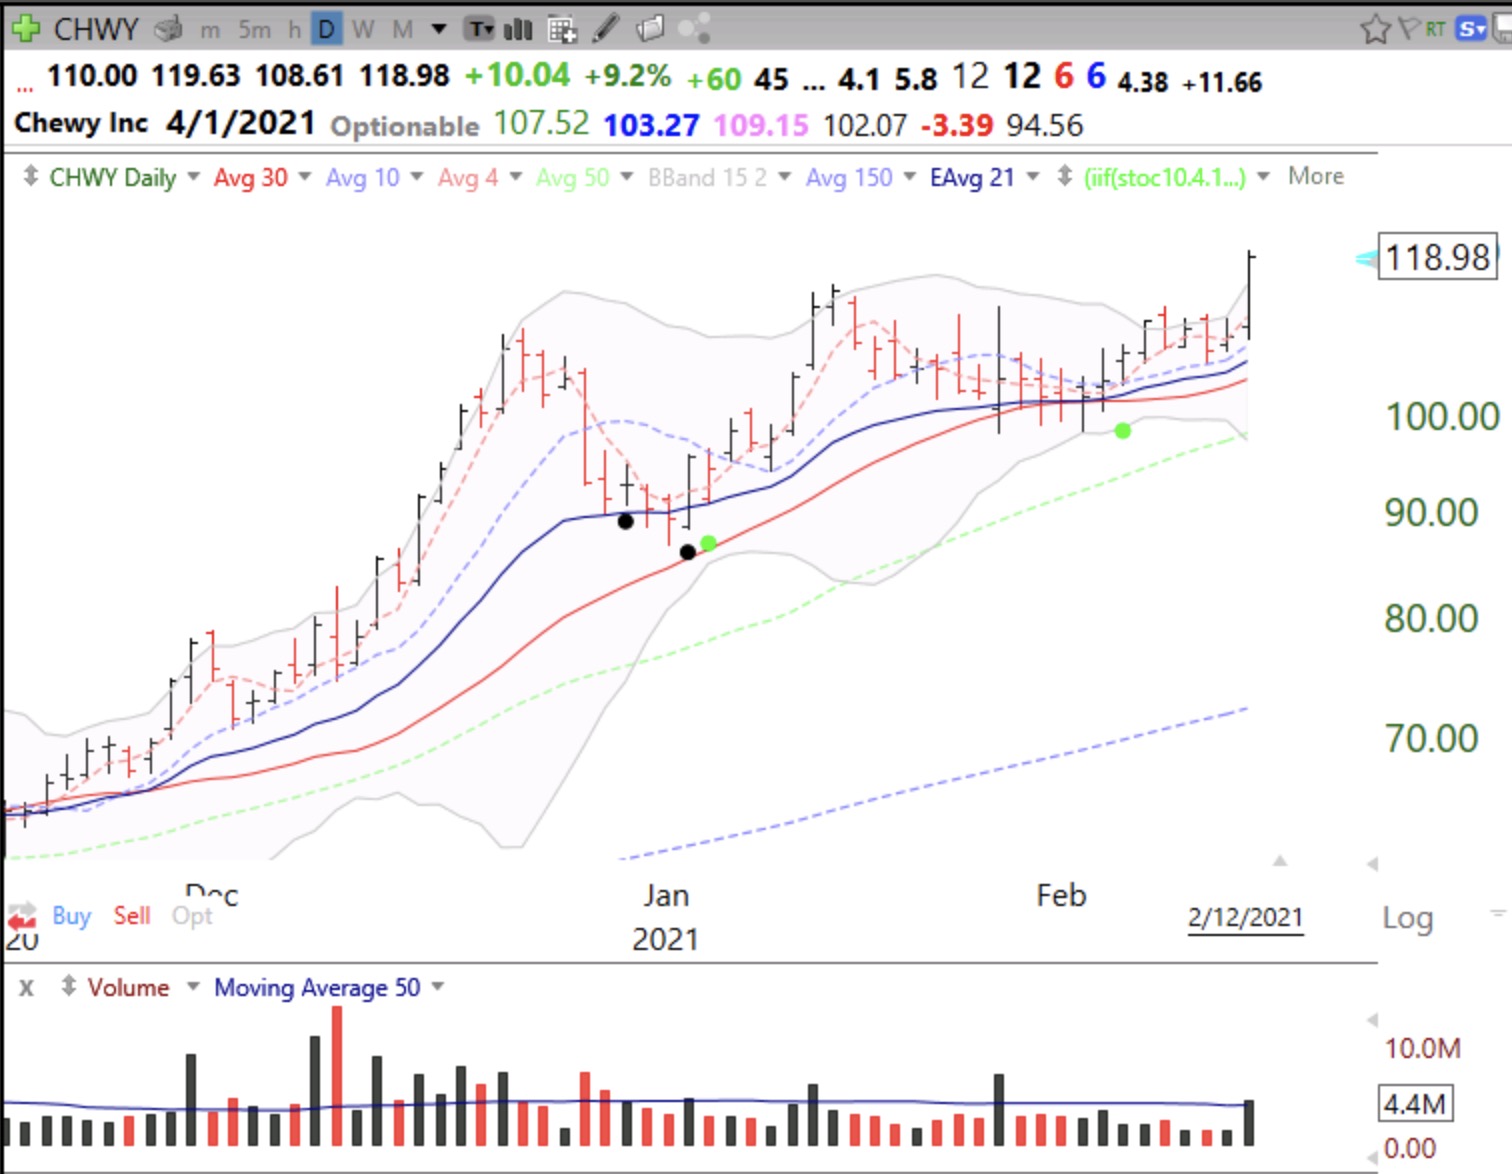
See my post on CHWY here. The GLB signal works!
Stock Market Technical Indicators & Analysis
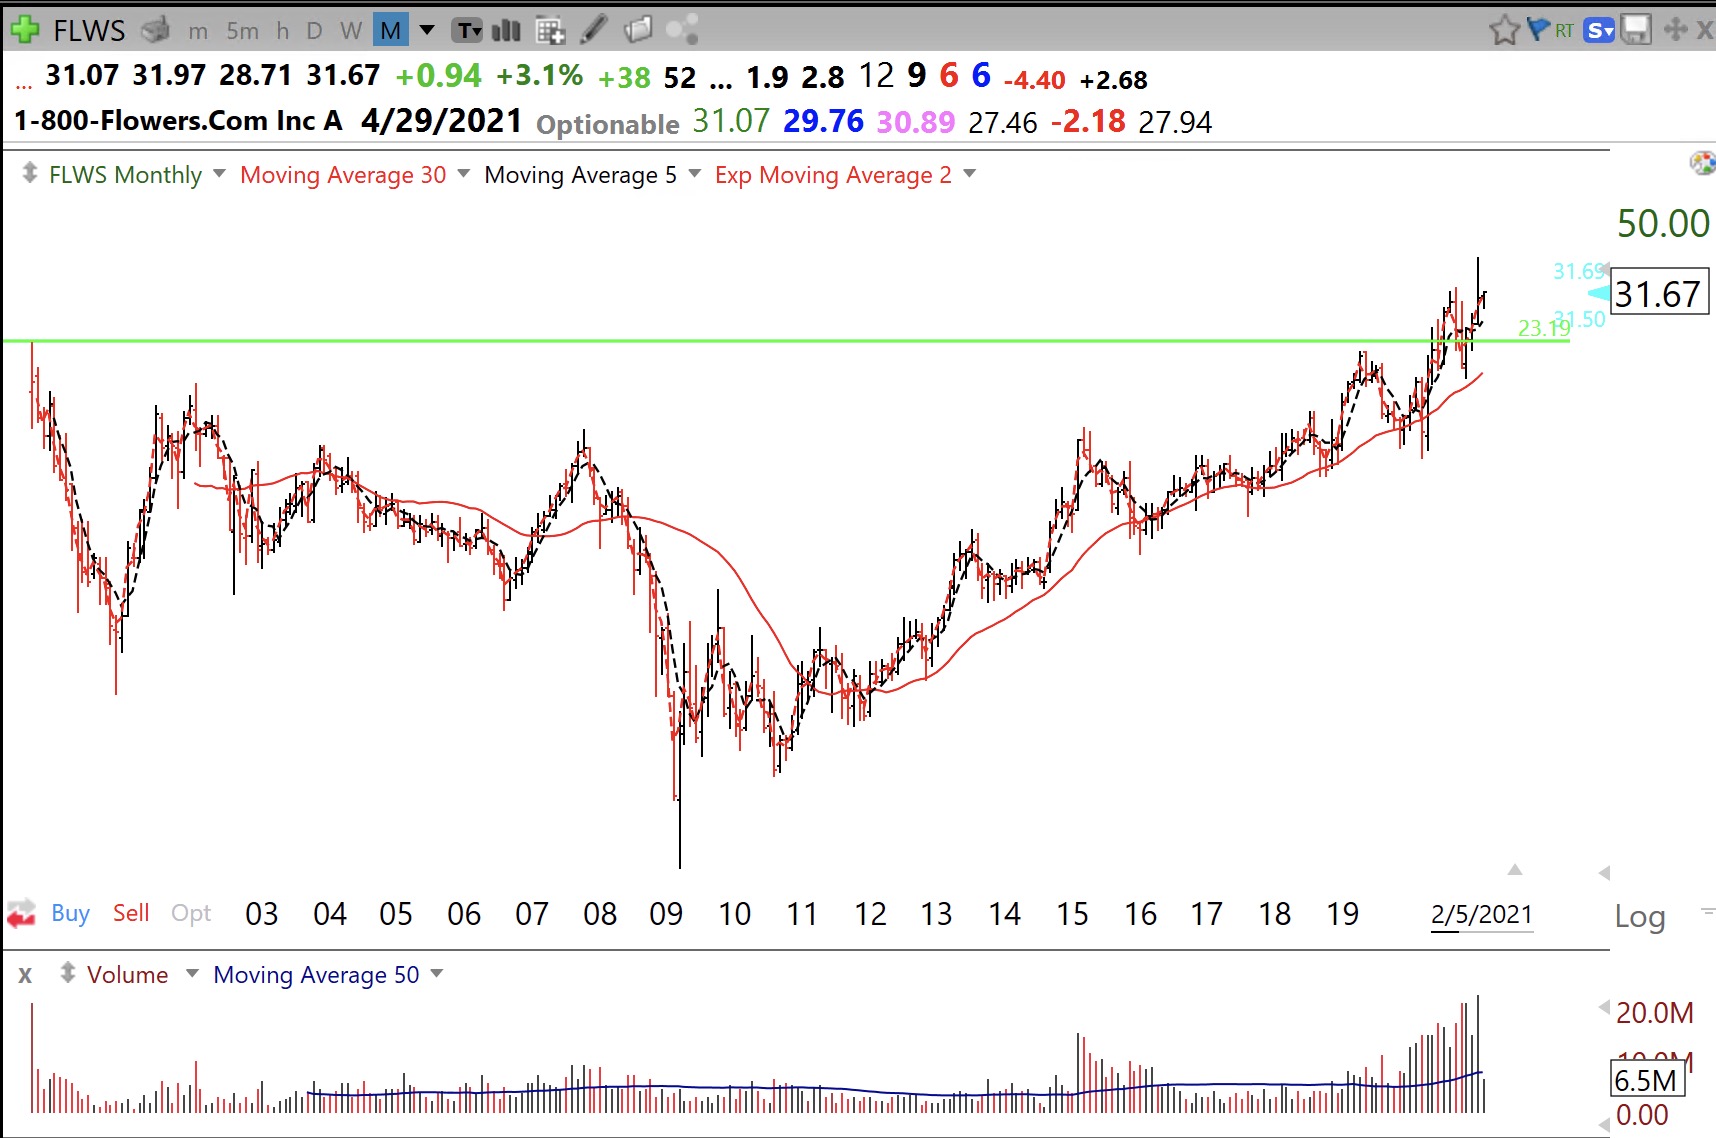
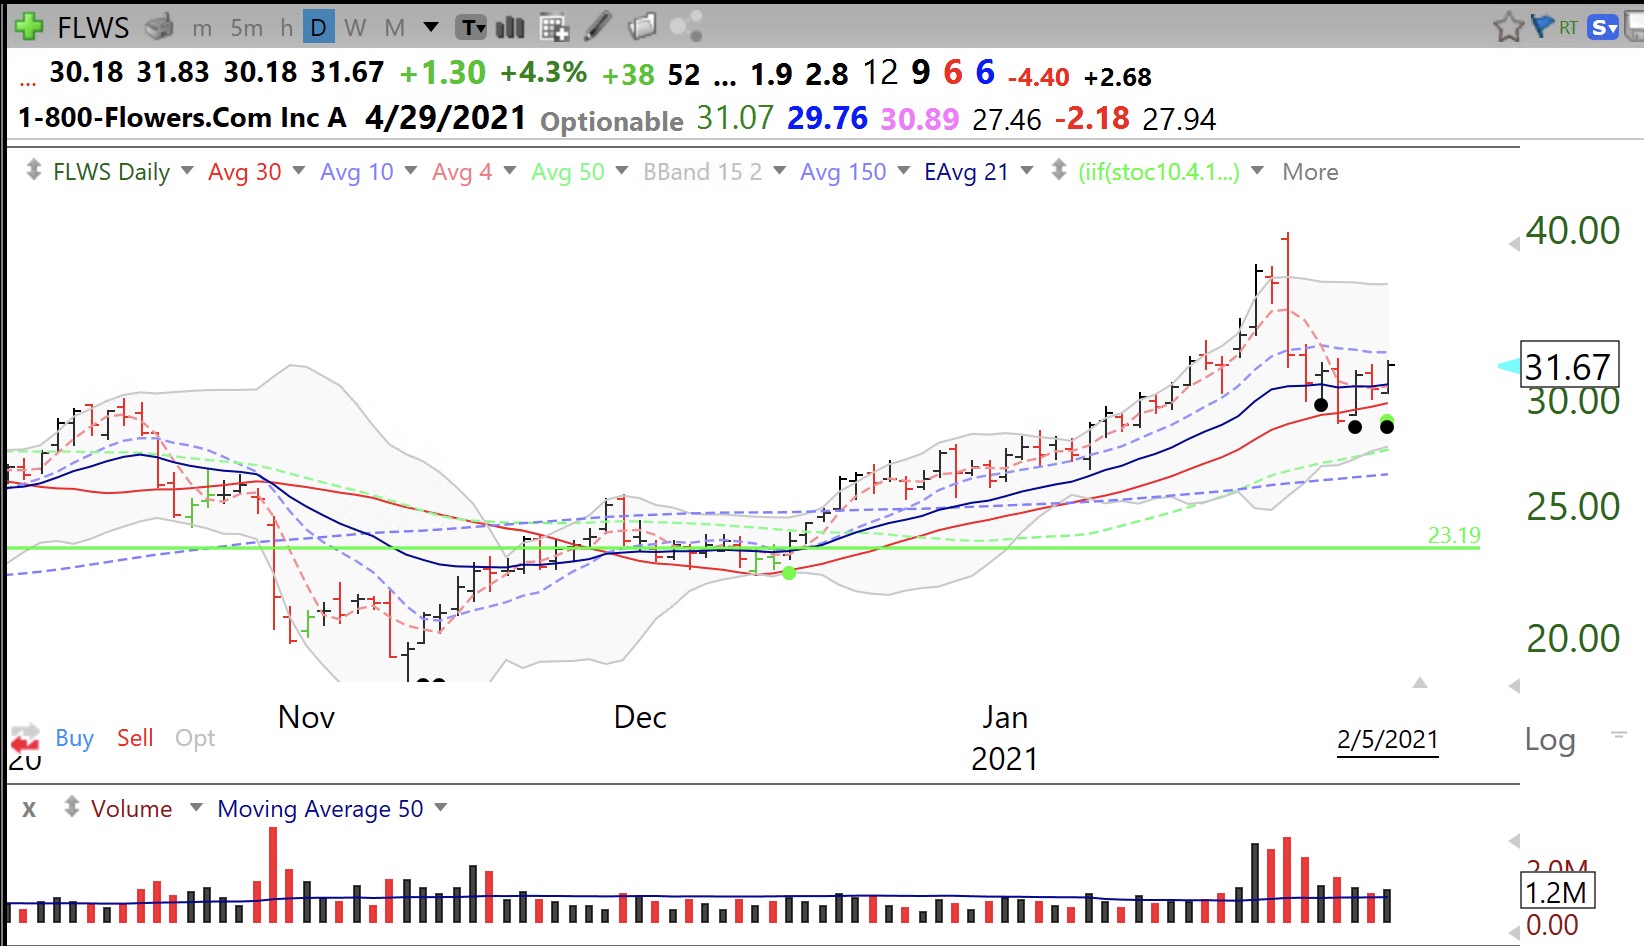 FLWS (1-800 Flowers) popped up in my scan for promising oversold stocks this weekend. With Valentines Day coming and people afraid to visit stores, is this business primed to blossom? Note it had a recent retest of its GLB to an ATH after it broke through its 1999 top and may now be getting ready to grow from oversold, as the green and black dots suggest. If one had bought the stock when it cam public, s/he would have had to wait 20 years to get their investment back! That is why I only buy IPOs when they have a GLB. It also had a WGB, not shown. Note also in the monthly chart below that it had increasing trading volume the past year. Buying an up-trending stock that may bounce from oversold levels can be a minimal risk strategy if one sells quickly if the stock breaks its nearby support. FLWS’ earnings are projected to grow +66% in 2021 (MarketSmith). Next earnings are expected 4/29/2021……..
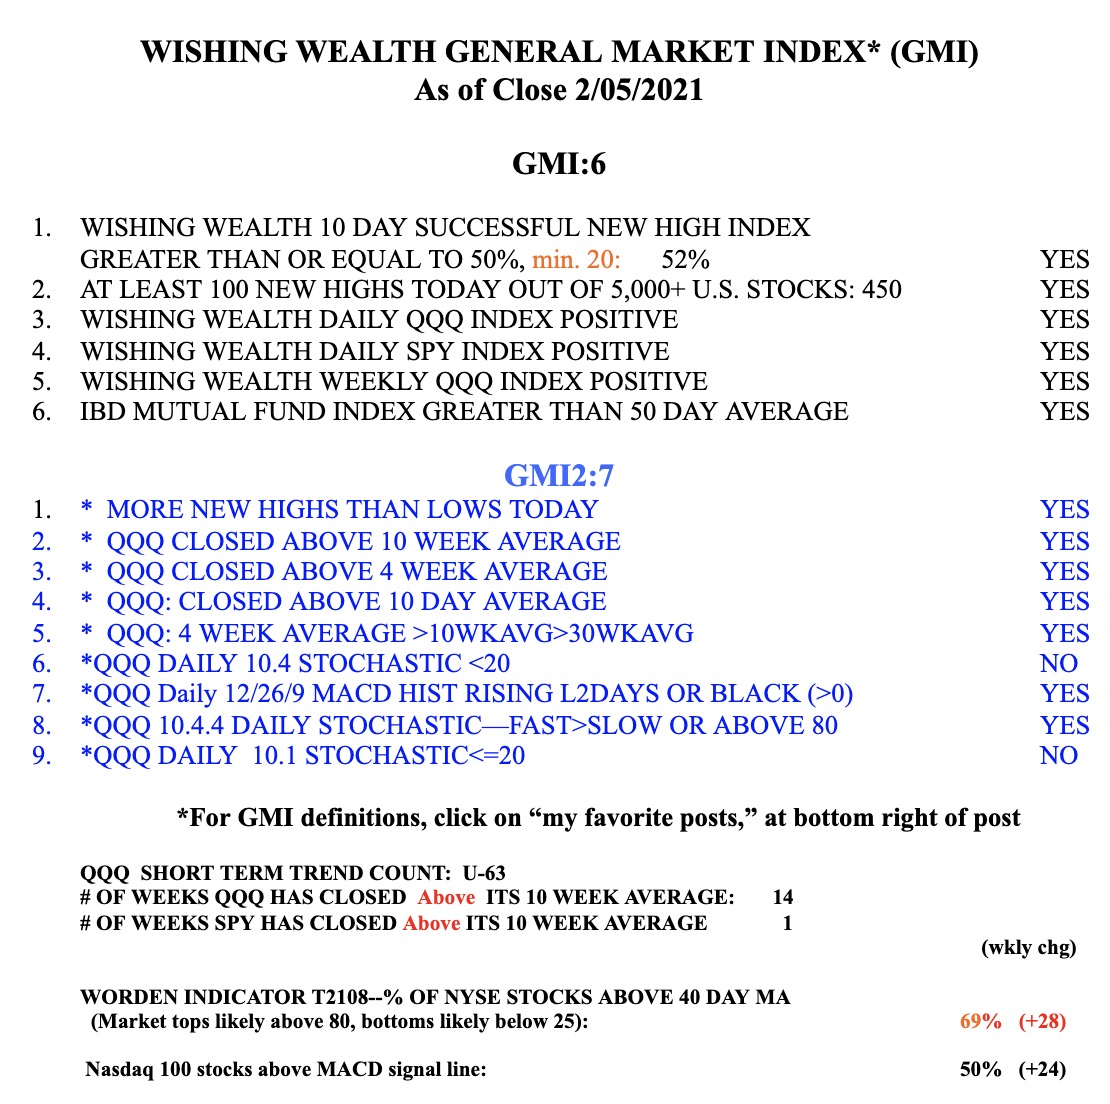
I have added a 9th component to the GMI2. The GMI2 table exists to remind me each night to check its components. I do not use the sum of positive components as a signal, the way I do with the GMI. So don’t worry about the change. The new component measures if the 10.1 daily stochastic is <= 20, designating a very short term oversold level. The 10.1 moves faster than the other stochastic component, the daily 10.4. I have found that in a market up-trend, when the major indexes or individual stocks correct, they often bottom or bounce when these stochastic indicators become very oversold. My green and black dot indicators on my charts rely partially on these daily stochastic indicators. The stochastic indicators help me to time my entrances, but their overbought signals do not work well for timing my exits…….
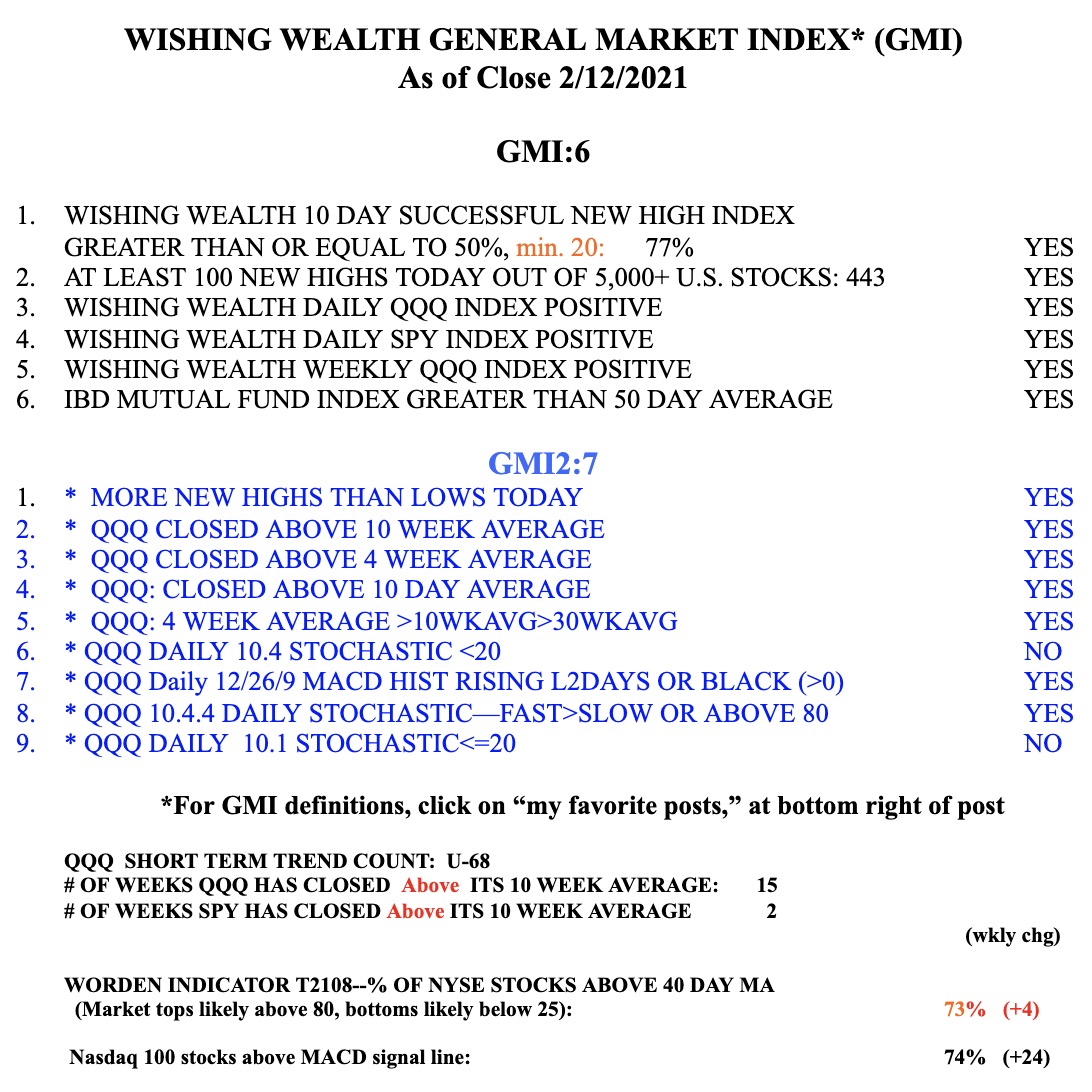
The GMI remains Green and at 6 (of 6). The SPY has closed back above its 10 week average, after a one week detour.
I told you I went to cash more than a week ago when I did not like the action of my stocks and I saw that David Ryan and Mark Minervini tweeted that they expected a decline. It is easy to blame the market’s weakness on the GME shorting saga. However, could it be that we are about to suffer a resurgence of the virus leading to market weakness like we had last March? Maybe it is both causes, but regardless, it looks like the market could be in for a significant decline. Being in cash in my IRA trading account is comfortable because I can always reenter when the dust settles. I prefer to risk missing out on some new gains in order to avoid the greater risk of giving up my gains from the past year. I wait to transfer my university pension out of mutual funds to money market funds when my longer term indicators turn down. We are not there yet, but I am watching closely.
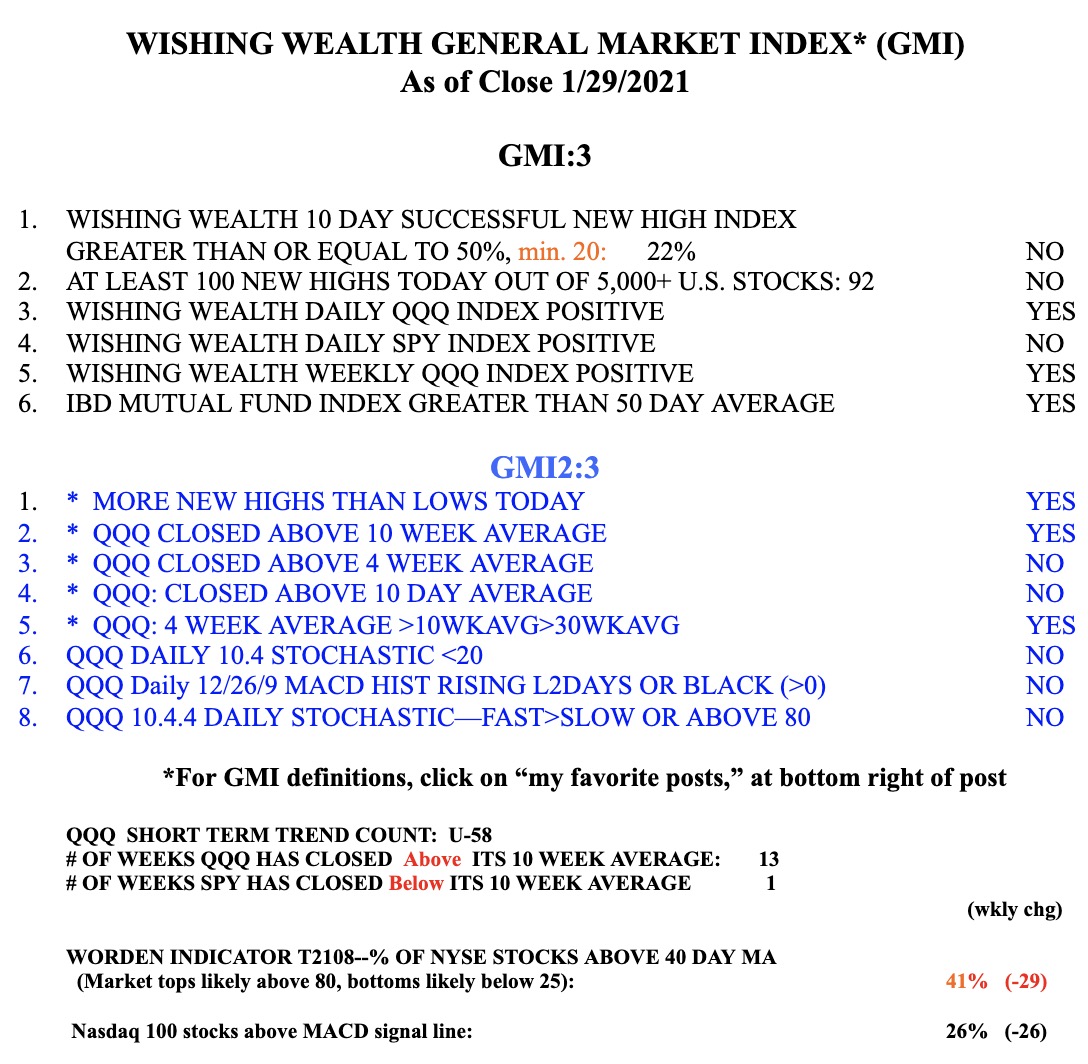
The indicators I follow are weakening. The Investors Intelligence poll of investment newsletter writers now registers 61% bullish. A contrarian indicator, market tops occur when this poll shows 60% or more bulls. SPY closed below its 10 week average for the first time since the end of October. DIA also enjoys this dubious distinction and QQQ is only 3.5 points above its critical 10 week average. The daily RWB up-trend pattern is gone for SPY and DIA. IBD, on investors.com, has just reduced their market pulse to an “uptrend under pressure.” T2108 has now fallen to 41% and important market bottoms occur when it reaches single digits. Many of my former students are writing to me about their large gains, another sign of a frothy market. Other indicators I watch suggest that the market is closer to the beginning of a decline than to an end. The GMI is at 3 and could turn to 2 with a weak day on Monday. Two consecutive days with GMI readings below 3 would turn it to an ominous Red signal. Finally, my QQQ short term trend indicator may signal a new down-trend by Monday’s close after 58 days of an up-trend. If the short term trend turns town, I will slowly accumulate SQQQ, the 3x leveraged inverse ETF that goes up three times as much as QQQ falls. However, it will decline 3X as fast as QQQ rises.
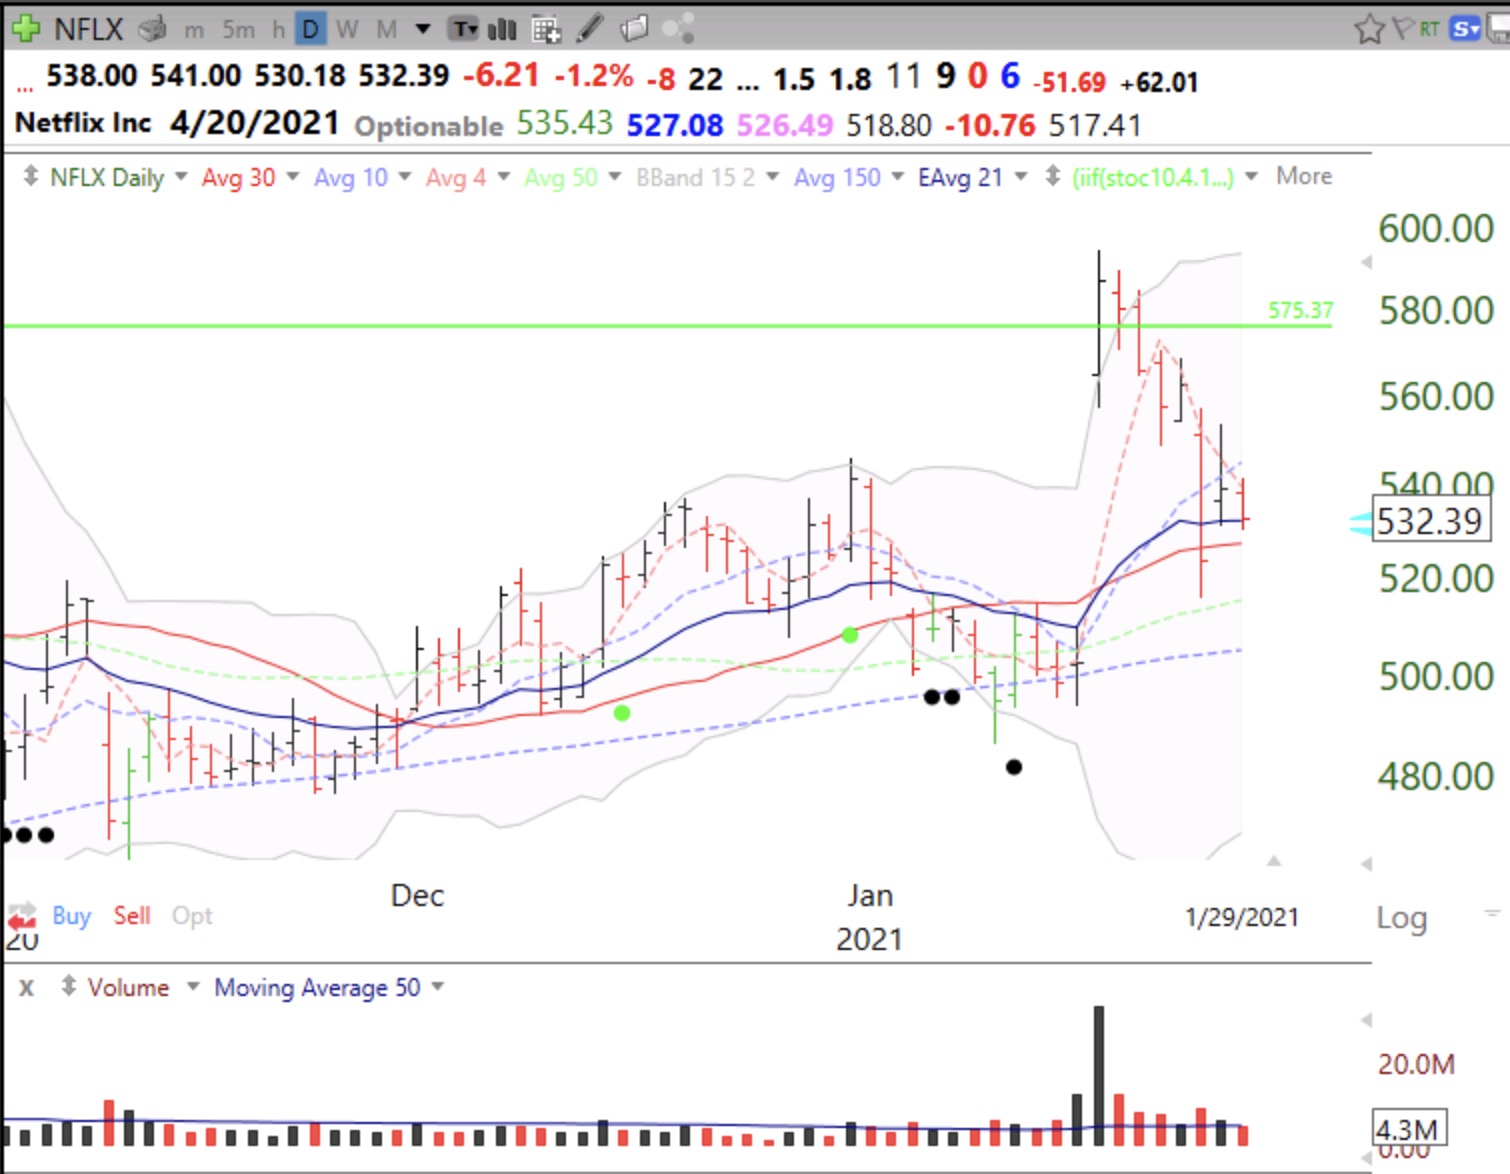
Failed break-outs are another sign of a weak market. Look at the recent failure of NFLX to hold its green line after its large volume earnings related green line break out (GLB) to an all-time-high.
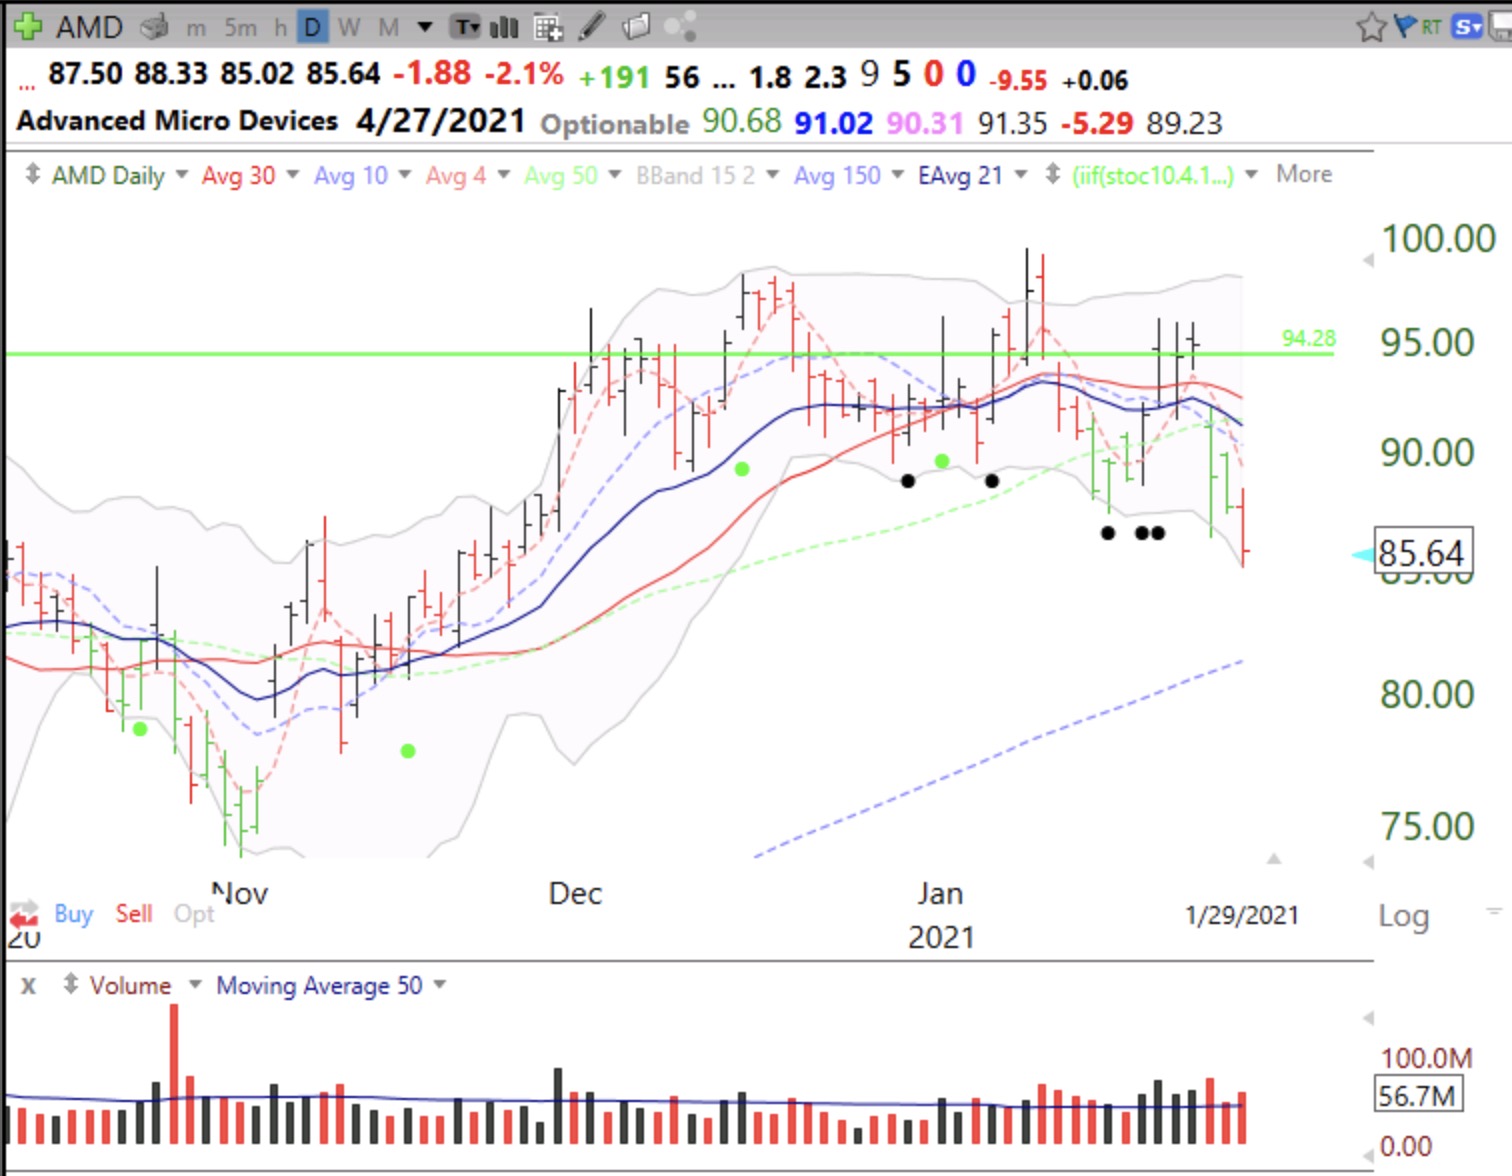
AMD also had a failed GLB. If I buy a GLB, I must always sell as soon as a the stock closes below its green line.
A bull market makes us all look like geniuses. As the saying goes, you don’t find out who is swimming naked until the tide goes out.