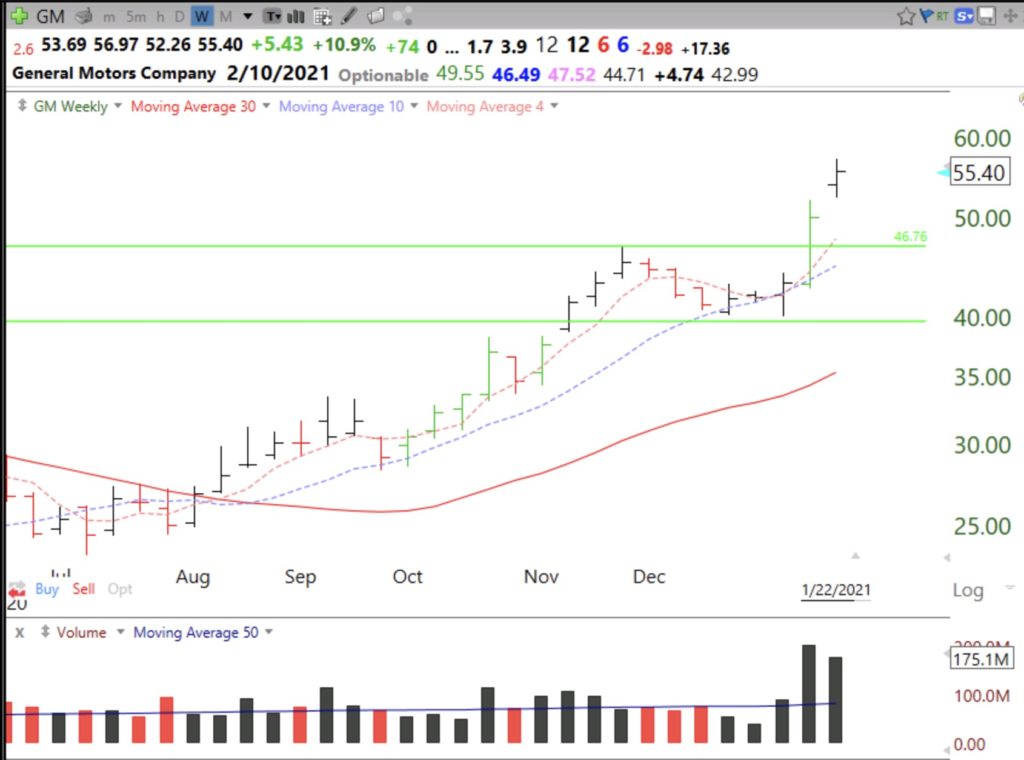
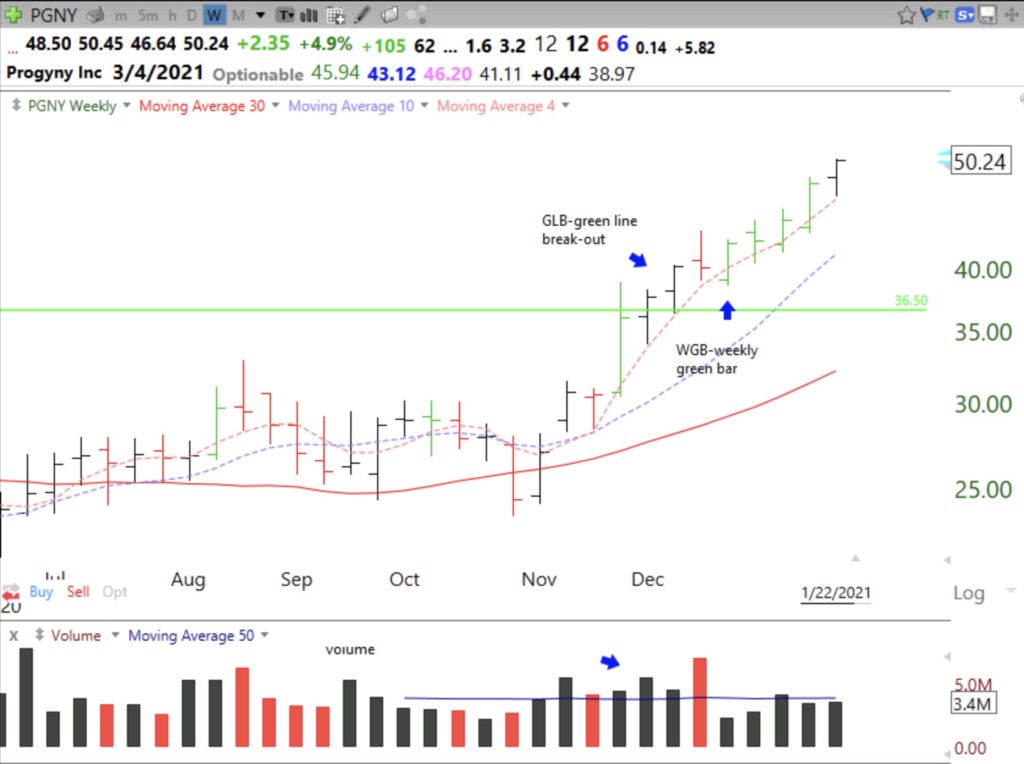
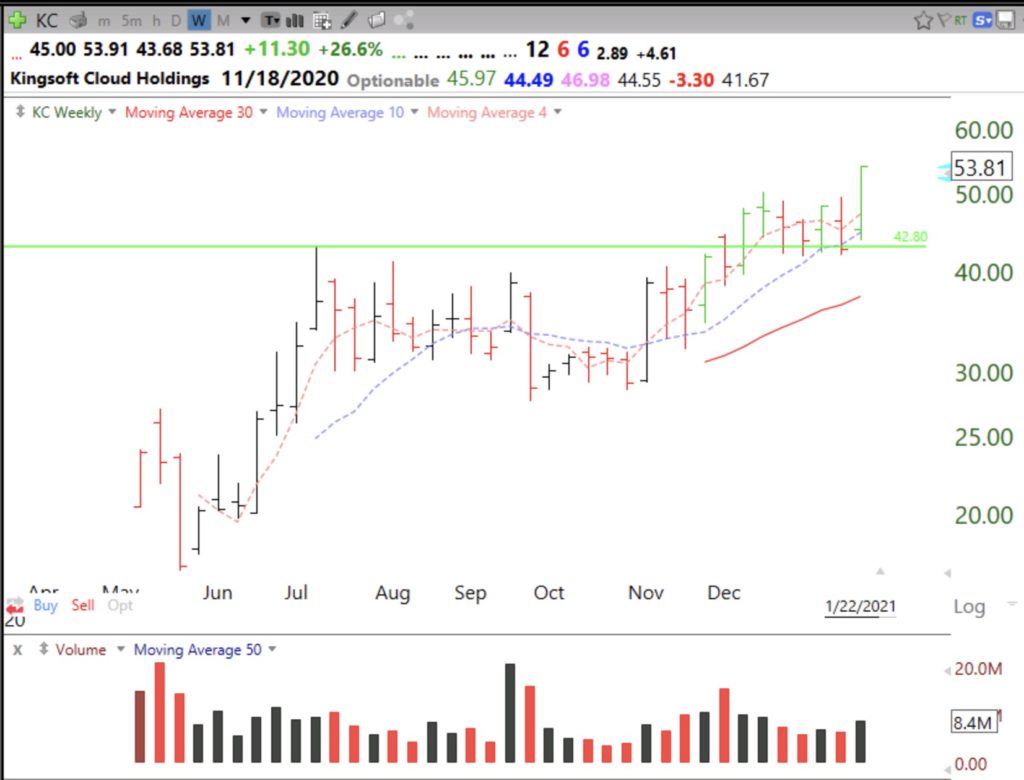
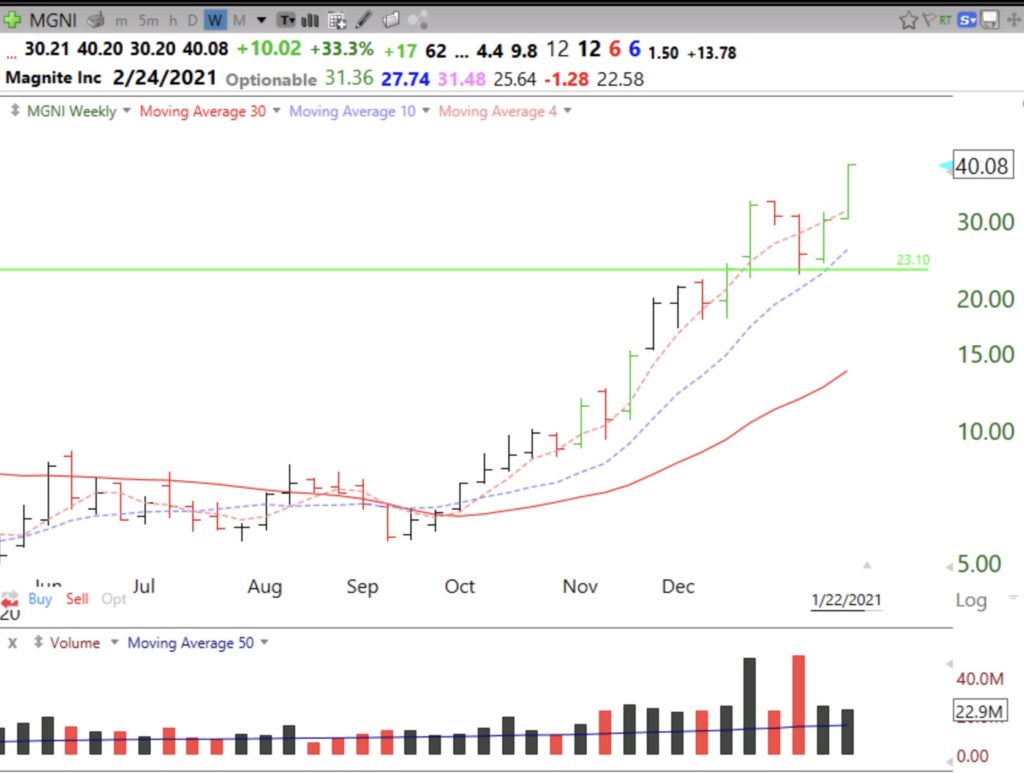
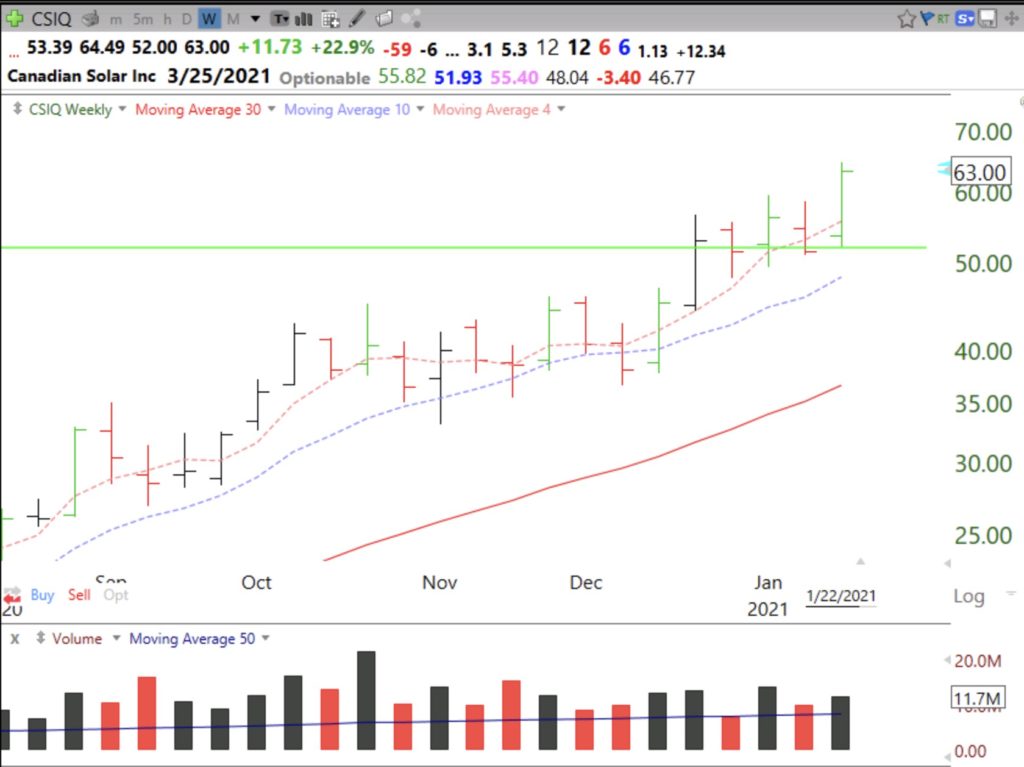
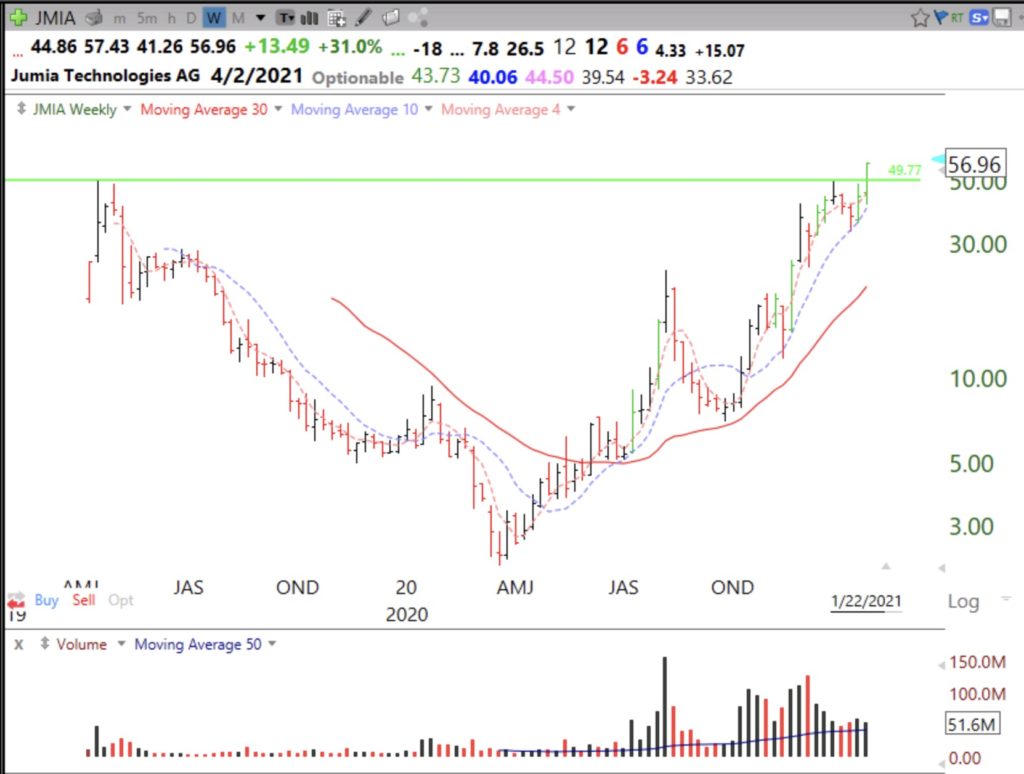
Blog post–In the 60s, I used to receive a book containing monthly charts of stocks. I noticed that stocks that reached an all time high (ATH), declined for a few months, and then went on to a new ATH were often big gainers. I therefore created my green line break-out (GLB) strategy many years later. I describe GLB in this post and provide 6 recent examples: $JMIA $GM $PGNY $KC $MGNI $CSIQ

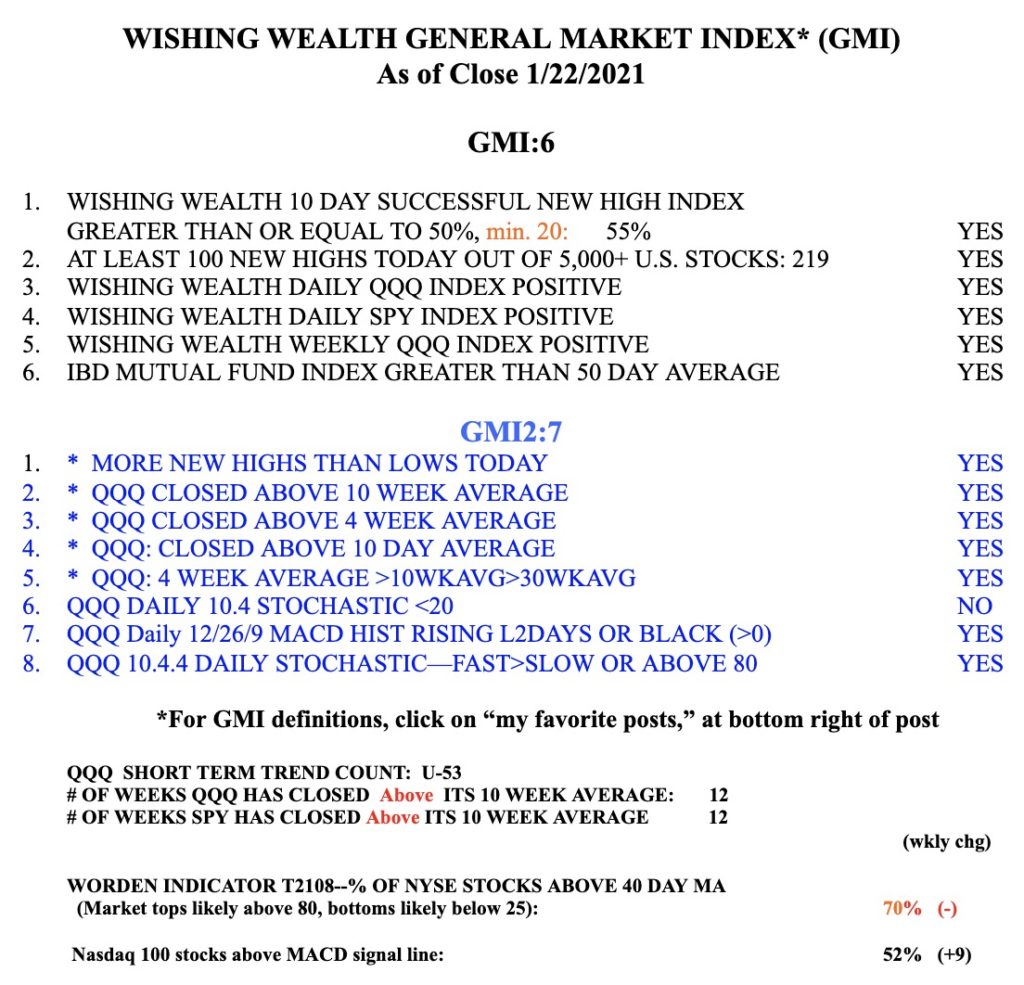
GMI6/6
GMI-27/9
T210870%

I decided to draw a green line on a monthly chart at the highest price bar reached, the all time high (ATH), that was not exceeded for at least 3 subsequent price bars (i.e. 3 months). Conceptually, the green line indicates an equity that has traded at an ATH and then went sideways or down below the ATH for a minimum of 3 months. In other words, the stock formed a peak and then entered a period of consolidation. A green line break-out (GLB) occurs the first time the equity finally closes above the green line. The GLB is most significant if it occurs on above average daily trading volume.

Why should a GLB be a bullish sign? People who bought the stock near the peak price and watched it go down or nowhere for months often only want to get their money back by selling if the stock rises back to near where they purchased it. This constitutes over head supply or selling pressure all the way back up to the green line. If a stock can overcome this overhead  supply and break out to an ATH it is showing considerable buying interest and technical strength. That is why GLBs often prove promising.

GLBs are even more significant if they occur in a recent IPO. The great trader, Jesse Livermore, spoke about the terrific set-up of buying a recent IPO that consolidated and then broke out to an ATH. And Nicolas Darvas wrote that he liked to buy stocks that had already doubled in the past year and that were trading at an ATH. For a very recent IPO, I might draw the green line after only 1-2 months of consolidation. A GLB on an IPO is often bullish because most people are not aware of this new security or many figured they missed it as it consolidated after coming public. As the stock climbs to new highs there will be many new buyers who notice and want to accumulate it.

There are several ways I find GLBs. All involve using the TC2000 software program for analyzing stocks which I have used for over 20 years. All of my students receive academic accounts so they may learn to use TC2000. (You can receive a discount coupon for trying it at the top of this site.) I can scan for stocks hitting a 52 week high with this formula (H=maxh52 on a weekly setting or h=maxh250 on a daily setting) and then review their monthly charts. Many of these stocks may be at a yearly high but remain below their ATH. I do look back 20 or more years because I want only ATHs. I then draw in their green line at the top of the peak monthly bar that has not been surpassed for at least 3 months and then with a simple right click of the mouse on the green line, set an alert to tell me anytime in the next year that the stock trades above the green line. TC2000 sends out alerts on screen, text and email. I can also see if any stocks hitting a new high have just crossed their green line top. Once I draw in the green line it appears on all charts I pull up for the stock.

After I buy a GLB, I must follow it to make sure it closes above the green line. Stocks often retest the break-out and will trade flat above the green line, or even below it. I do not set a stop loss for a GLB to avoid being sold out when a stock trades intraday below the green line only to close the day above it. If near the end of the day it appears that the stock will close below the green line I immediately sell and take a relatively small loss. When any buy set-up fails, I must exit. Most great traders who speak the truth say they are wrong  50% or more of the time but succeed because they sell their losses quickly while they are small and let their gains grow larger. After a loss, I console myself with the thought  that every loss brings me to the next gain.

I sometimes tweet out a new GLB intraday (@WishingWealth) but it is important to remember that it is impossible to know in advance which ones will work out. I also may check the company’s fundamentals on investors.com or MarketSmith before buying. In a strong market up-trend like the present, GLBs often work out. In addition, one of the rules I teach my undergraduate students is to buy only stocks in an up-trend that are trading above their last green line top if they missed the break-out. Here are some weekly charts of examples of recent GLBs.


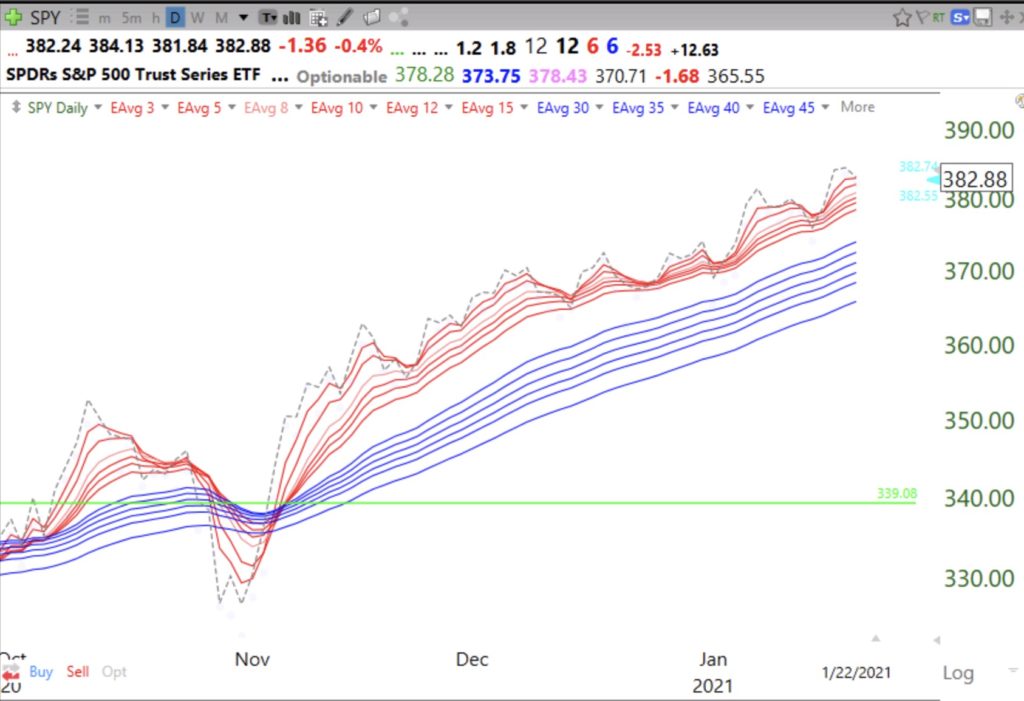
The GMI remains at 6 (of 6) and on a Green signal. SPY remains in a daily RWB up-trend pattern.
Blog post: For the first time many individual stocks outperformed just holding $TQQQ during a $QQQ short term up-trend; IBD/MarketSmith growth stocks did best while FAANG stocks faltered; $QQQ on support

GMI6/6
GMI-24/9
T210870%

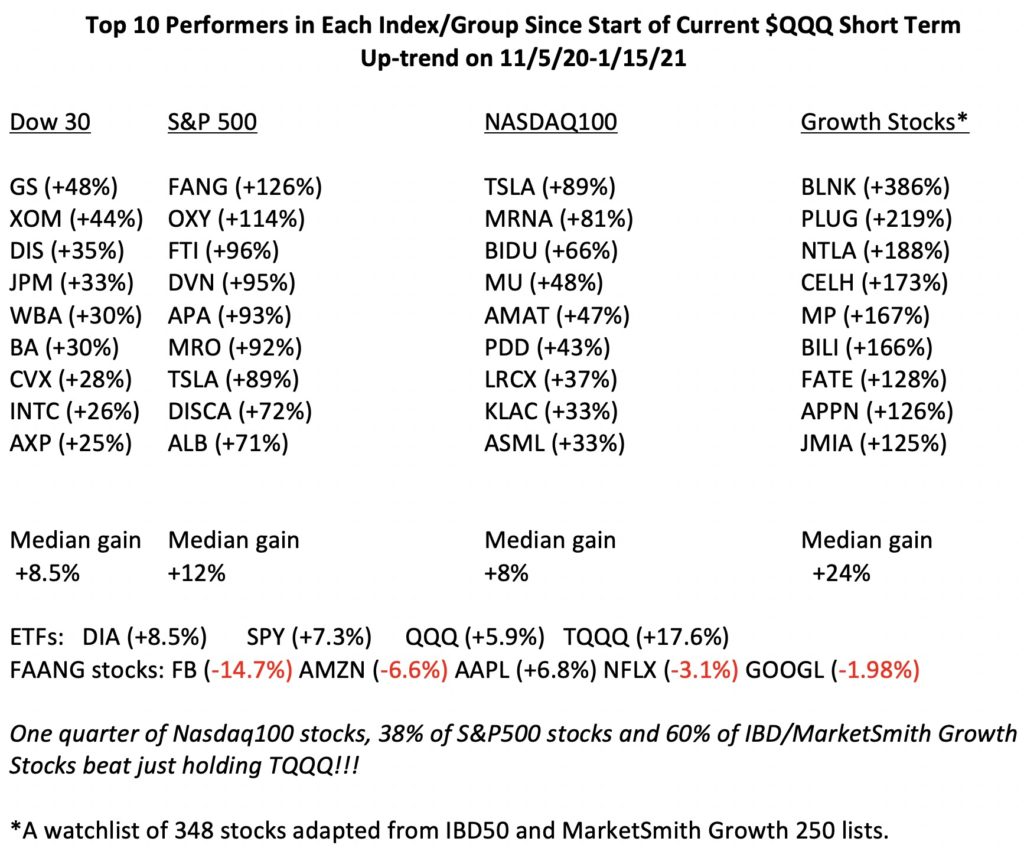
For many years I have shown that holding the triple leveraged Nasdaq100 ETF, TQQQ, in an up-trend would have outperformed 90% or more of the individual stocks in the major indexes. This weekend I found unexpected results, presented in the table below. As expected, during the time since I identified the beginning of the current QQQ short term up-trend on 11/5/20, QQQ has gained +5.95% while its 3x leveraged ETF gained an expected +17.6%. (TQQQ is designed to move 3x QQQ but this goal is not always exactly achieved.) This table shows the top 10 performers in 4 groups of individual stocks, Dow30, S&P500, Nasdaq100 and a Growth Stock watchlist I created based on stocks primarily cited in IBD50 and MarketSmith250 growth lists over a number of months.

I began  to trade profitably after I started receiving the IBD newspaper in the mid 1980s. IBD specializes in market timing and identifying the greatest growth stocks.  IBD initially published an IBD100 list of promising growth stocks, which has now become the smaller IBD50 list. Their site, investors.com, also posts lists for IPO Leaders and other groups of stocks.  MarketSmith, the modern growth stock platform also run by IBD, publishes the Growth250 list which contains the results of various scans they run to identify promising stocks. Periodically, I import stocks on these lists to a watchlist in TC2000 so I can analyze them using the many technical indicators and scans I have created over the past 30+ years.

What amazed me today was that I found that about 25% of the Nasdaq100 stocks,  38%  of the S&P500 stocks and 60% of the IBD/MarketSmith Growth Stocks beat just holding TQQQ!  In the past, only about 10% or less of the individual stocks in the major indexes beat TQQQ. I never compared TQQQ to the growth stocks before but I assume they would have outperformed them too. Note also the relatively small gains in the top 10 Dow 30 stocks (+25% to+48%) compared with the top 10 gains in the other indexes. I was surprised to find that the top 10 stocks in the S&P500 (+71% to +126%)  outperformed the top stocks in the Nasdaq100 (+33% to +89%) even though this was a period defined by the QQQ being in a short term up-trend. However, note that SPY (+7.3%) did beat QQQ (+5.9%). The top 10 stocks in my Growth Stock list put the other lists to shame (+125% to +386%). Now I know many readers will say that the larger the list the more chance that one can find 10 outstanding stocks. But note that the median gain in the Growth Stocks was +24%. This means that one half of the stocks in this list advanced more than 24%, far better than the 17.6% one would get by holding TQQQ. Also, most of the Growth Stocks were taken from lists accessed before December.

So maybe picking individual stocks now has a much higher probability as a strategy than formerly when TQQQ would beat 90%+ of individual stocks. Perhaps one can identify the 50% of stocks on the Growth Stock list that will greatly outperform TQQQ. My conclusion is to focus my attention on promising growth stocks as long as I manage the risk with stops and position size. Thanks to the efforts of Mark Minervini, @markinervini, and Irusha Peiris, @IBD_Irusha, my undergraduate students have the opportunity to learn how to use the IBD and MarketSmith platforms to find growth stocks. These experienced traders have even lectured to my students…….

One other unexpected finding I have presented in this table is that all of the FAANG stocks but AAPL have declined during this period. My preferred market gurus (Darvas, O’Neil) have written that the market leaders top before the general market does. So this is one more warning sign for the current market along with the high percentage (63.7%, source investors.com) of newsletter writers currently being bullish.

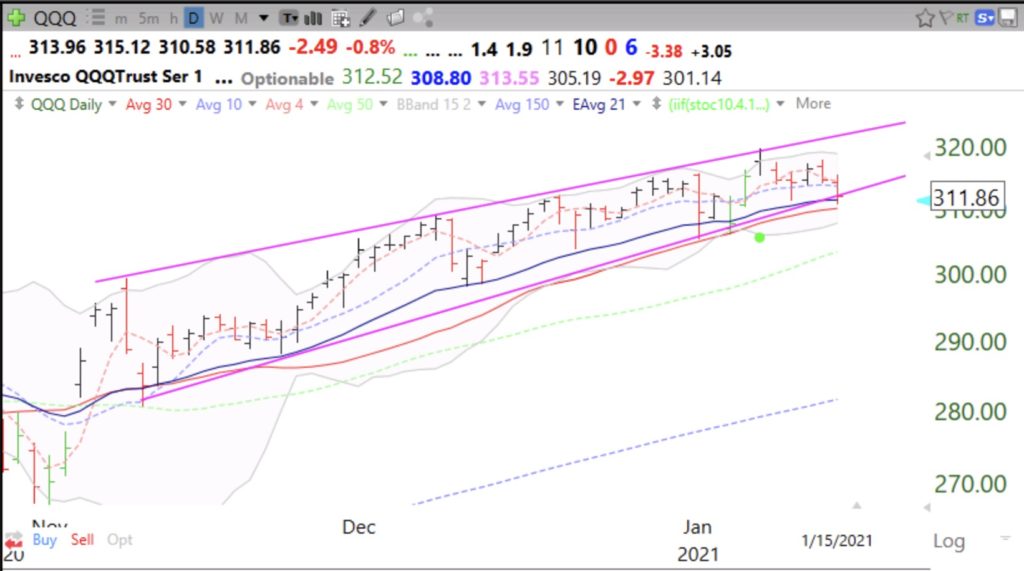
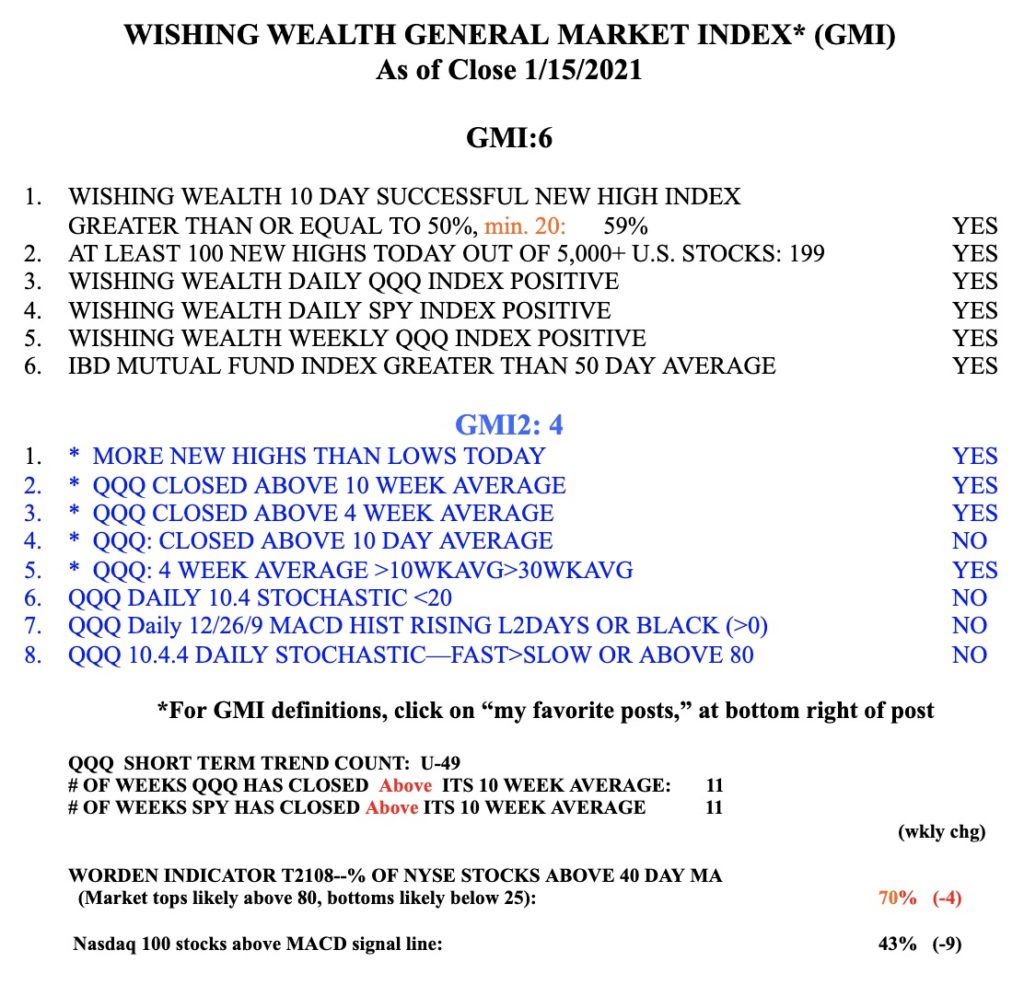
Nevertheless, the GMI remains Green and at 6 (of 6) but the more sensitive GMI2 is at 4, indicating some short term technical weakness. This chart shows that QQQ is sitting right on the bottom of its up-trend channel and therefore merits monitoring. This is where support has come in multiple times since November.   And note that prior advances  have stalled at the upper channel line.  In addition, after closing above its 4 week average for each of the the prior 10 weeks, QQQ has now closed last week below it. Most strong up-trends have weekly closes above a rising 4 week average. Not using charts is like driving to new places without Waze! I can do it but it is much more difficult and I may get lost.


Blog post: In spit of my feeling that things are too hot, my indicators suggest Mr. Market wants to climb higher

GMI6/6
GMI-27/9
T210874%

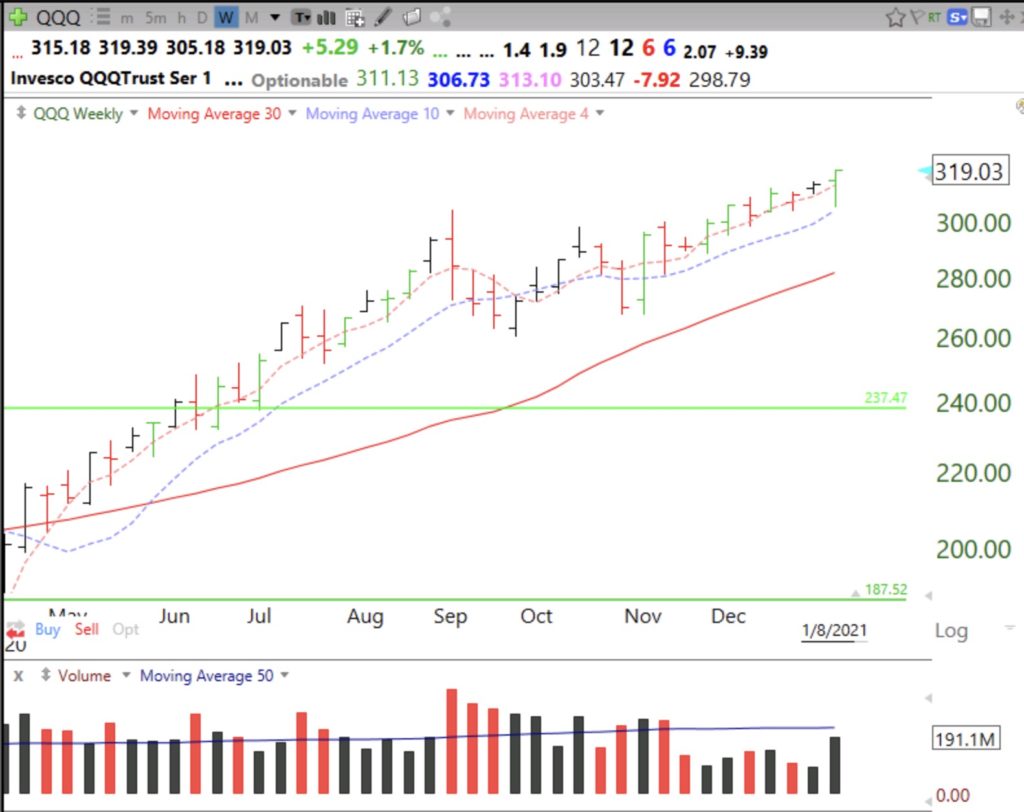
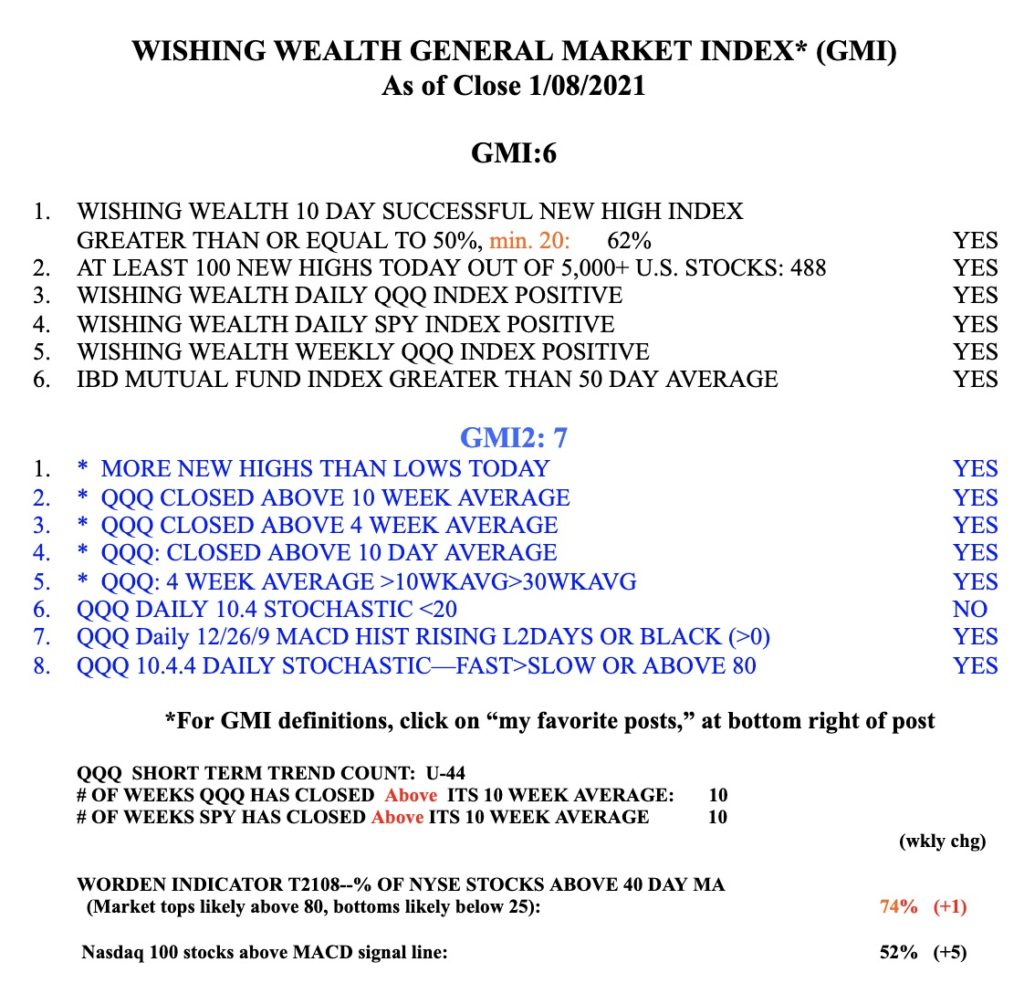
The market had 488 new yearly highs among US stocks on Friday and more than 500 on Wednesday and Thursday. The last time we had more than 500 new highs in a day was January 16, 2018!  Two weeks later the market had a 12% decline. I am a chicken and very defensive most of the time–I am too close to relying on my retirement funds to live on. When many millennials and my students are reporting large gains in their trading I get even more cautious and defensive. And 60%of investment newsletter writers are bullish, an ominous sign. For now, all of my indicators are positive and the DIA, SPY and QQQ all had WGBs last week. So the indexes are not extended above their 4 week averages.  But so few of these youthful traders have ever experienced a bear market decline which lasts for 10 or more months and grinds everything down. Is this time different? I do not think so. No stock , even TSLA, climbs forever. I remain heavily invested in mutual funds in my university pension. In my trading IRA I am largely in and out of cash. Below is the weekly chart of QQQ, showing its recent WGB (weekly green bar). A close below its 4 week average (red dotted line) will signal possible short term weakness. A close below the 30 week average (solid red line) will signal severe weakness and maybe a change in trend. The QQQ has closed the week above its 4 and 10 week averages for 10 straight weeks!

The GMI s 6 (of 6) and on a Green signal.