This weekend I created a new scan column in TC2000 that puts together most of the characteristics of winning stocks that I have embraced over the years. Some were suggesetd by the great Nicolas Darvas. Most, I created based on my trading experience and reading the past 50+ years. This scan finds stocks that meet the following criteria:
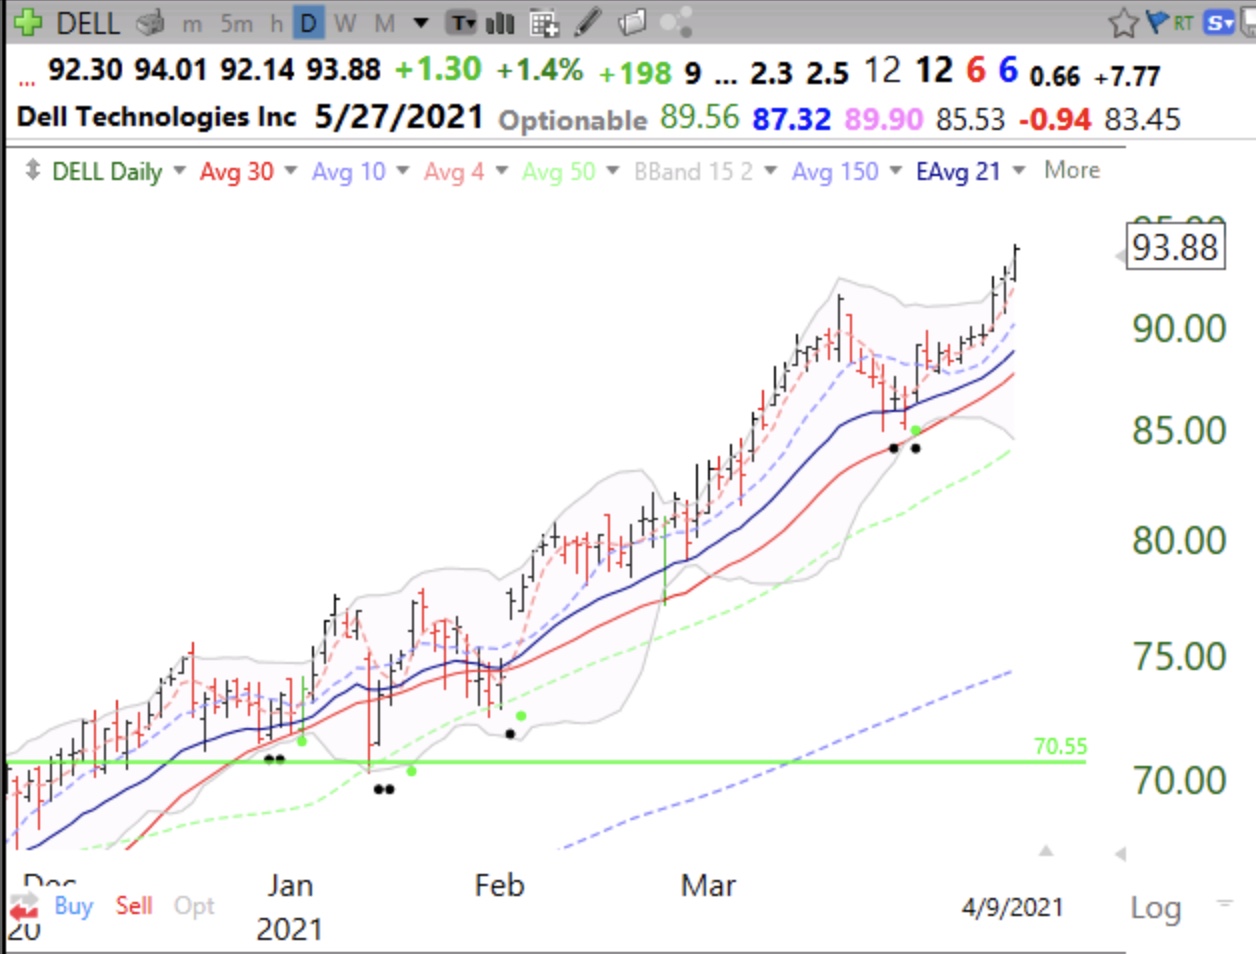
>$20, near all-time high, yellow band for 5+ weeks (see my 2012 TC2000 webinar link on my blog for the definition of yellow band stocks), reached a new high within last 25 days, closed up today, closed up >80% from a year ago (Darvas liked +100%), bounced up off of exp 21 day or simple 30 day average today.
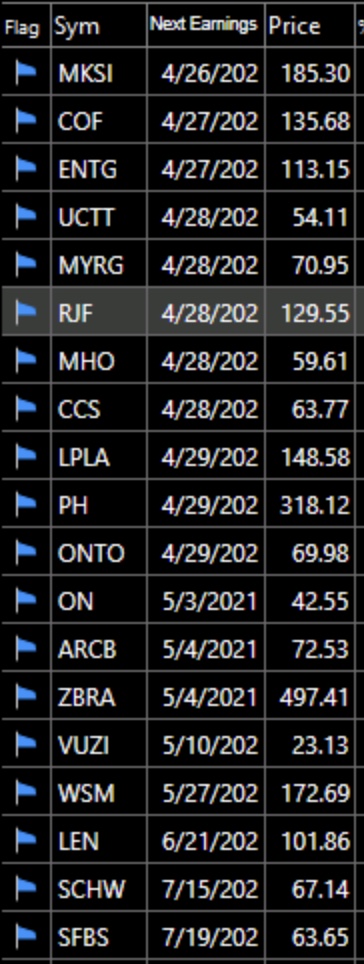
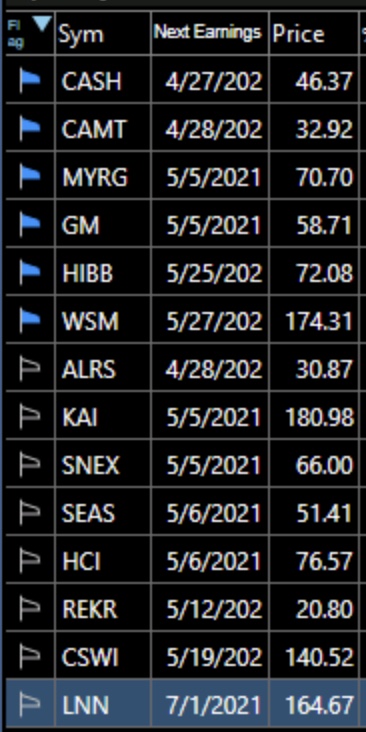
The 14 out of 6,081 US stocks that met these criteria as of Friday’s close appear below along with their projected next earnings dates. I copied these symbols into a watchlist to monitor on Monday with a column to show me whether Monday’s high is above Friday’s high, another sign of strength. Note that 6 of the 14 have a blue flag, indicating they came to my attention after appearing on an IBD or MarketSmith list in the recent past. I am not recommending these stocks and do not own any of them. They are listed for educational and research purposes only. Maybe some of these will turn out to be true market leaders. Remember, if I buy a stock after a bounce up off of one of these moving averages, I must sell immediately if it closes back below the average. The nice thing about this strategy is that it incorporates longer term and short term technical criteria. Before buying I check IBD or MarketSmith for strong fundamentals and projected earnings. I can run this scan every day near the close to look for possible winners.
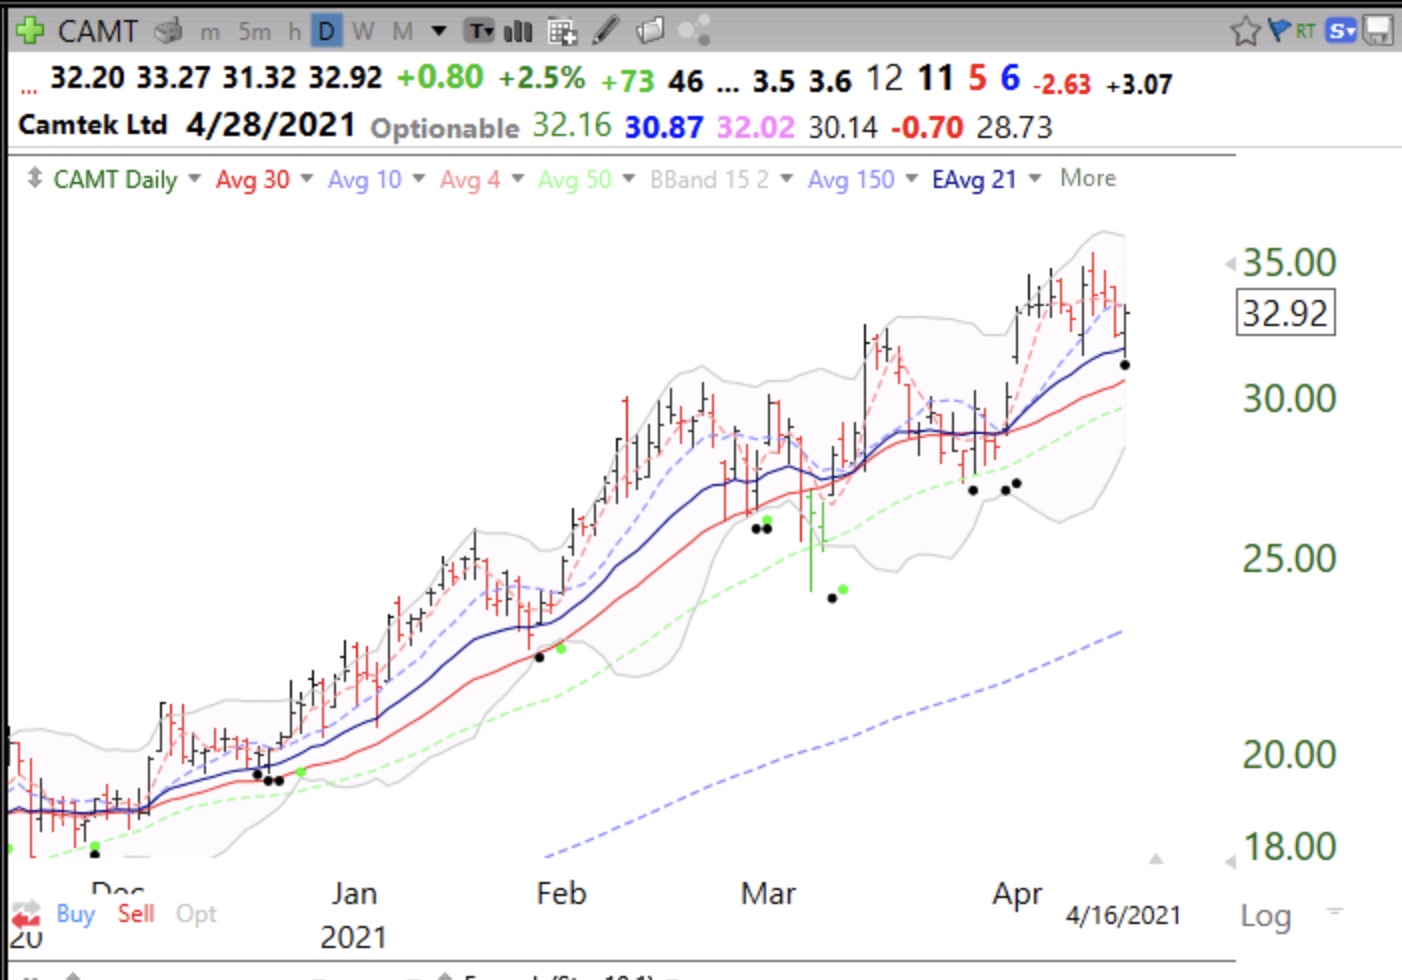
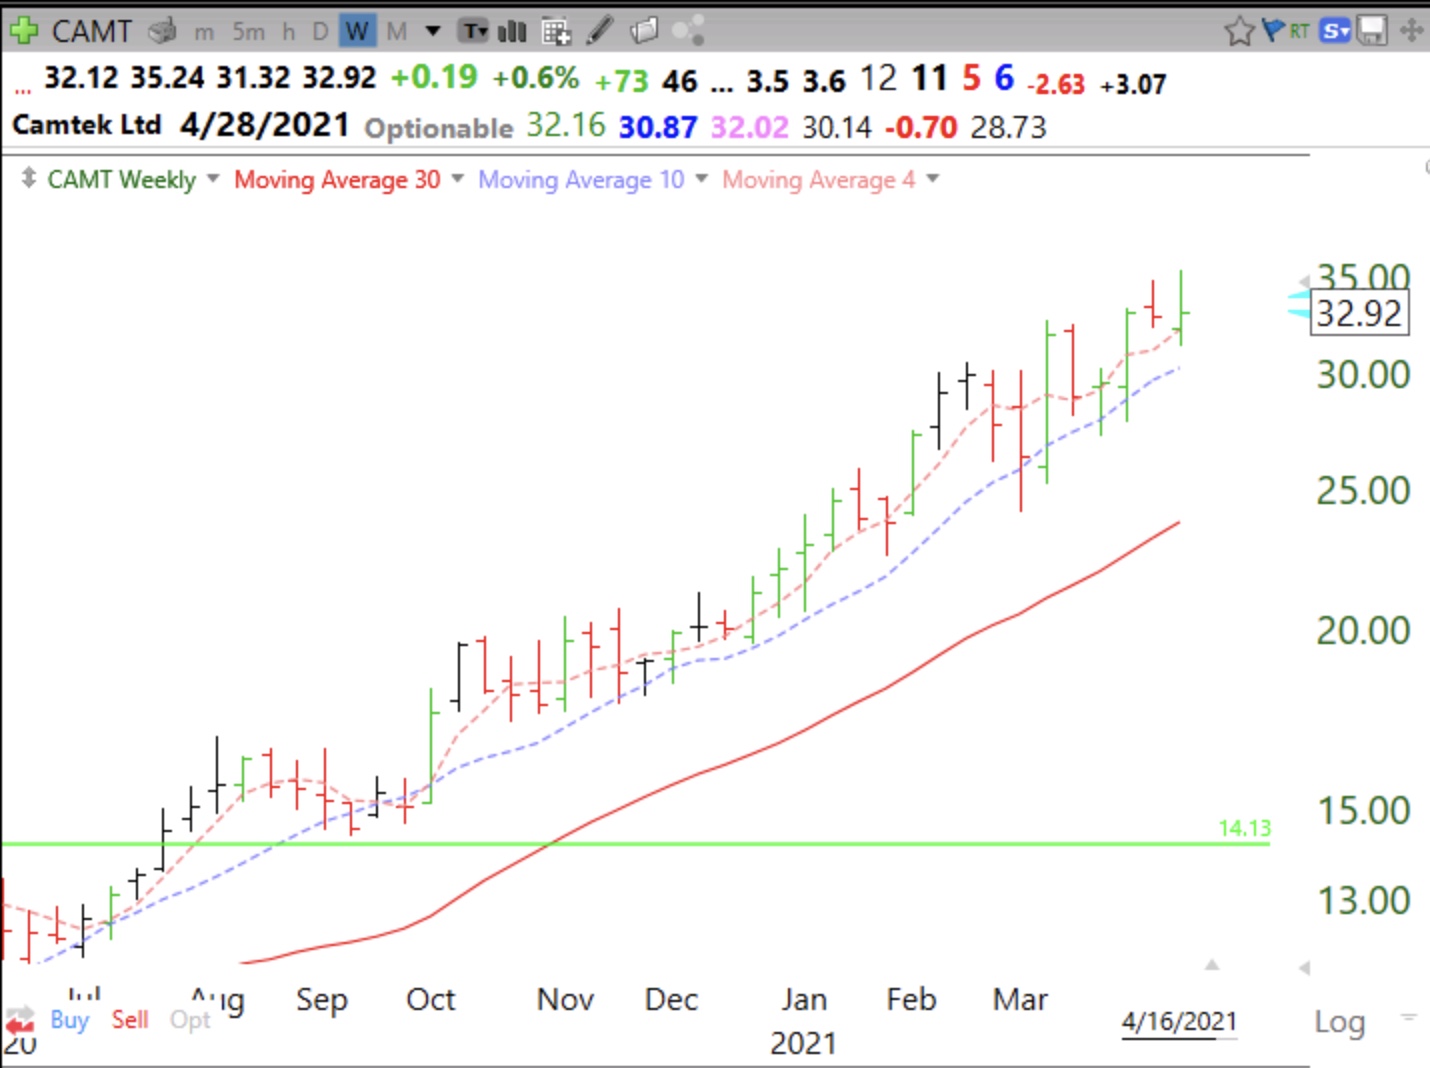
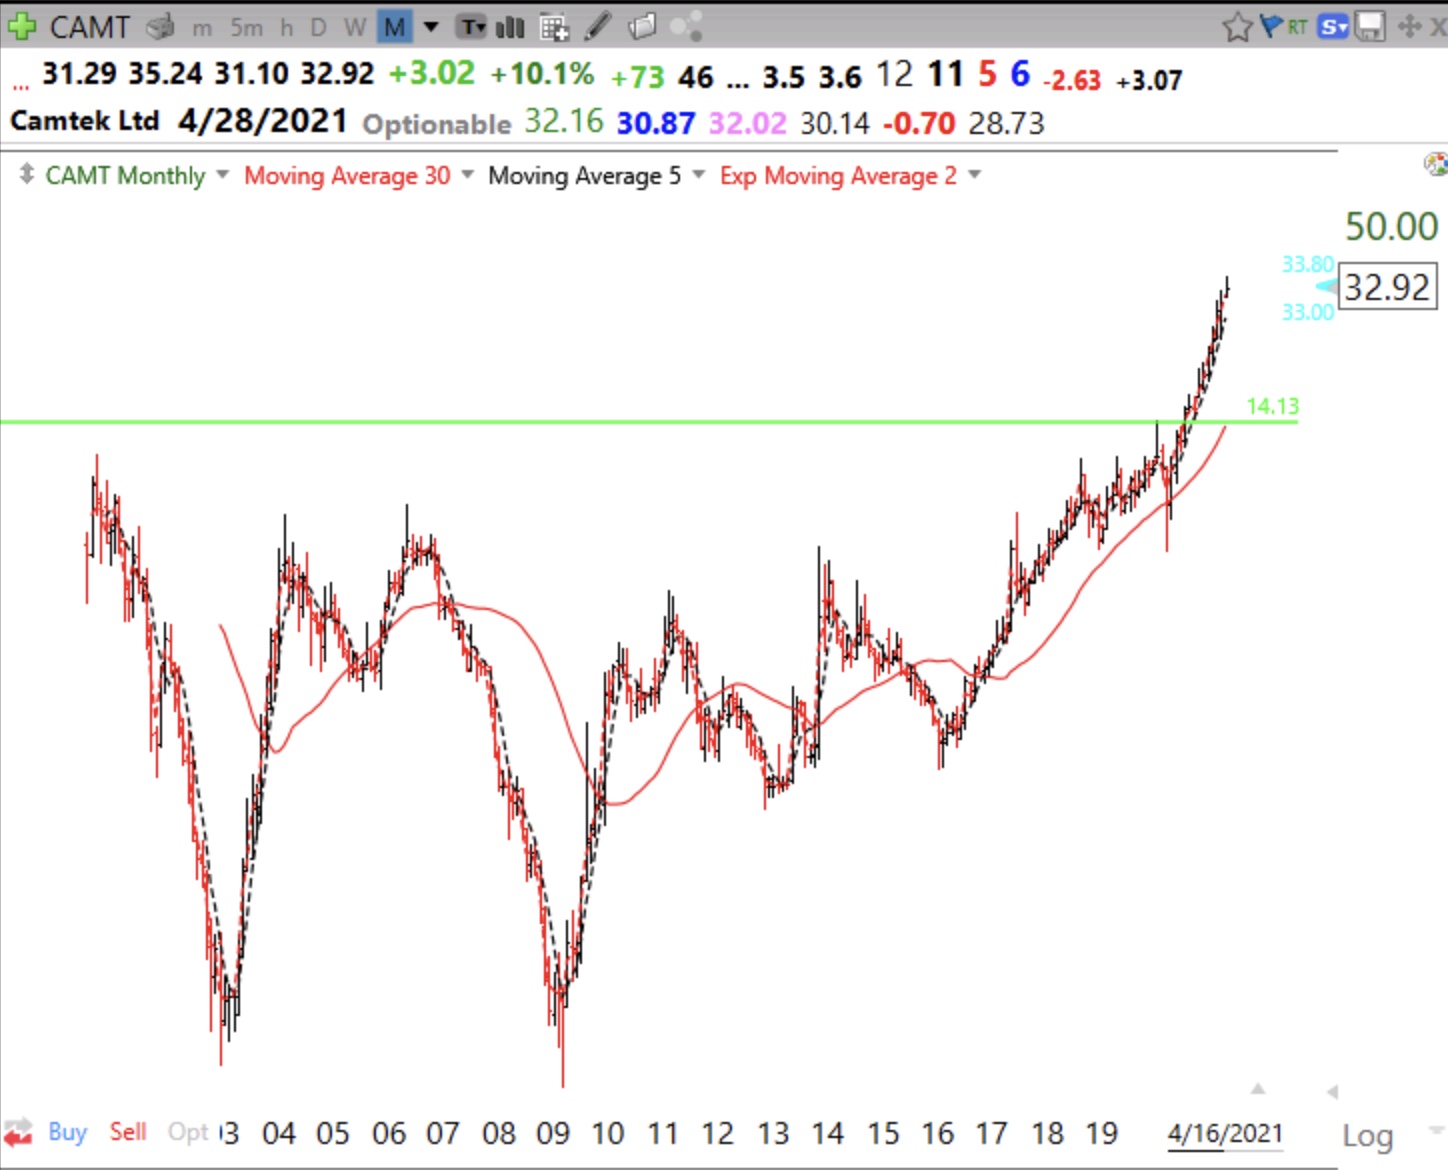
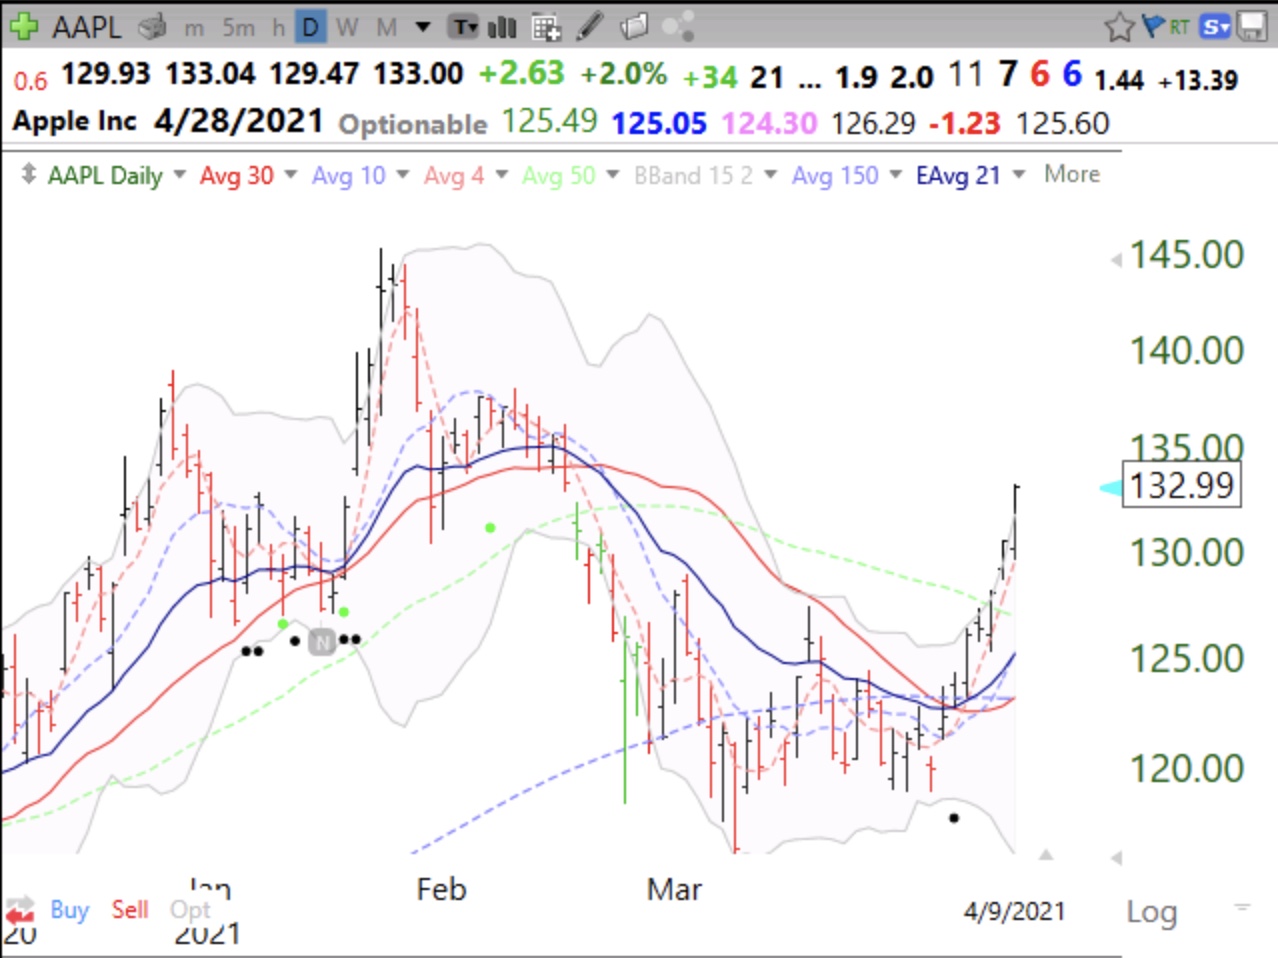
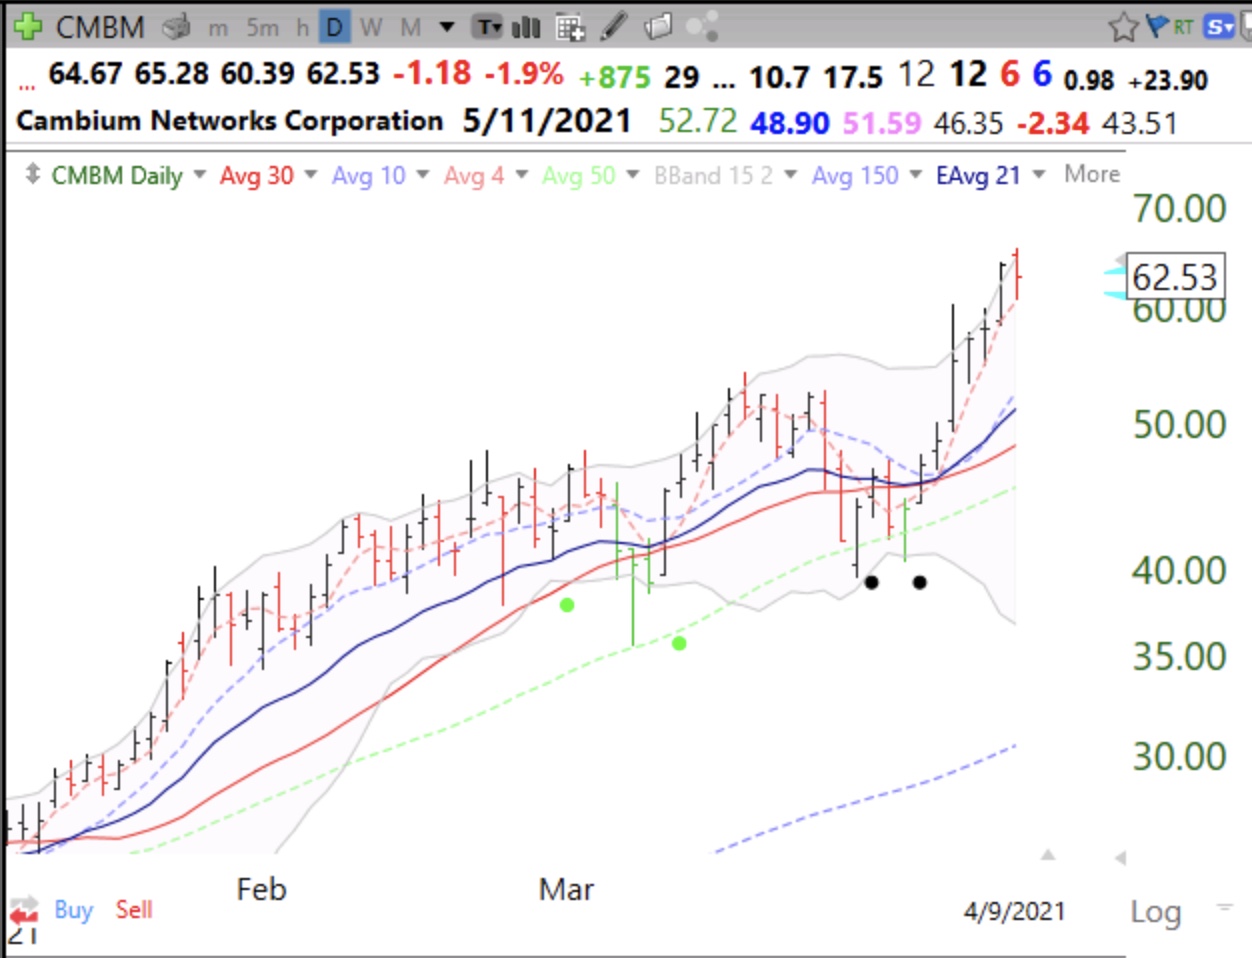
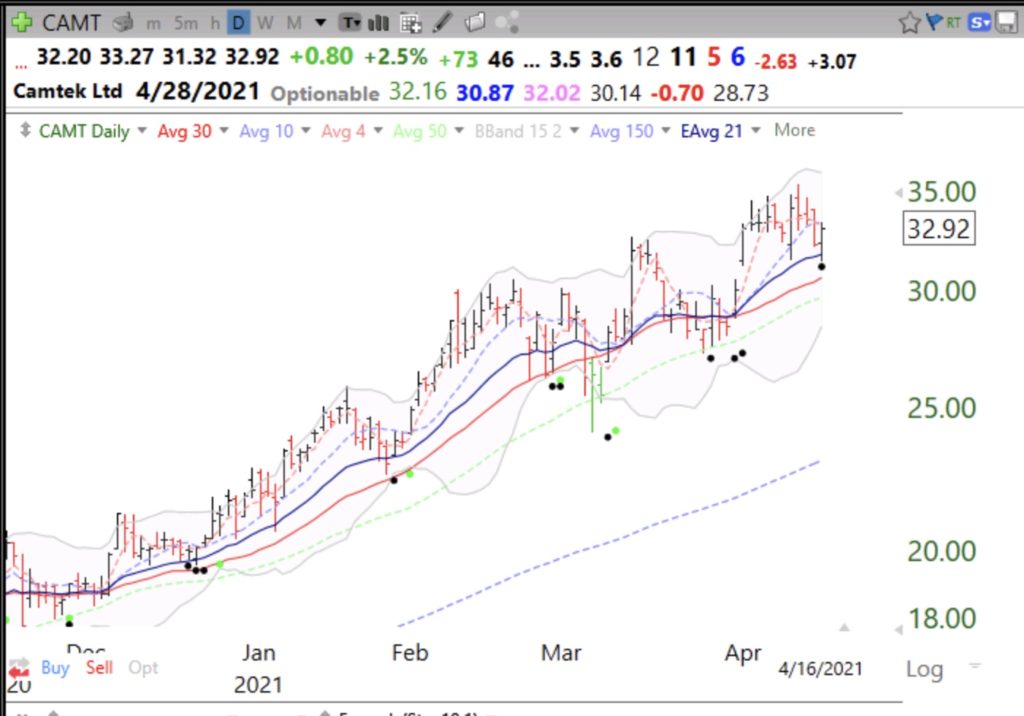
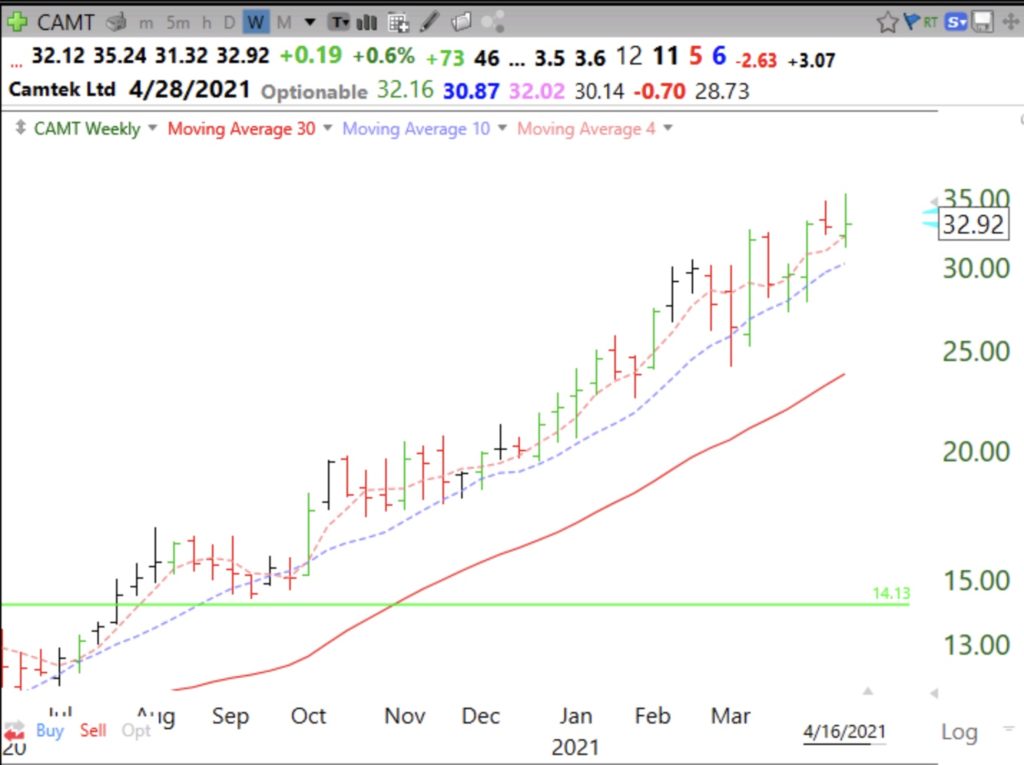
Here are the daily, weekly and monthly charts of one of these stocks, CAMT, as an example. Note the black and green dots showing oversold bounces on the daily chart.

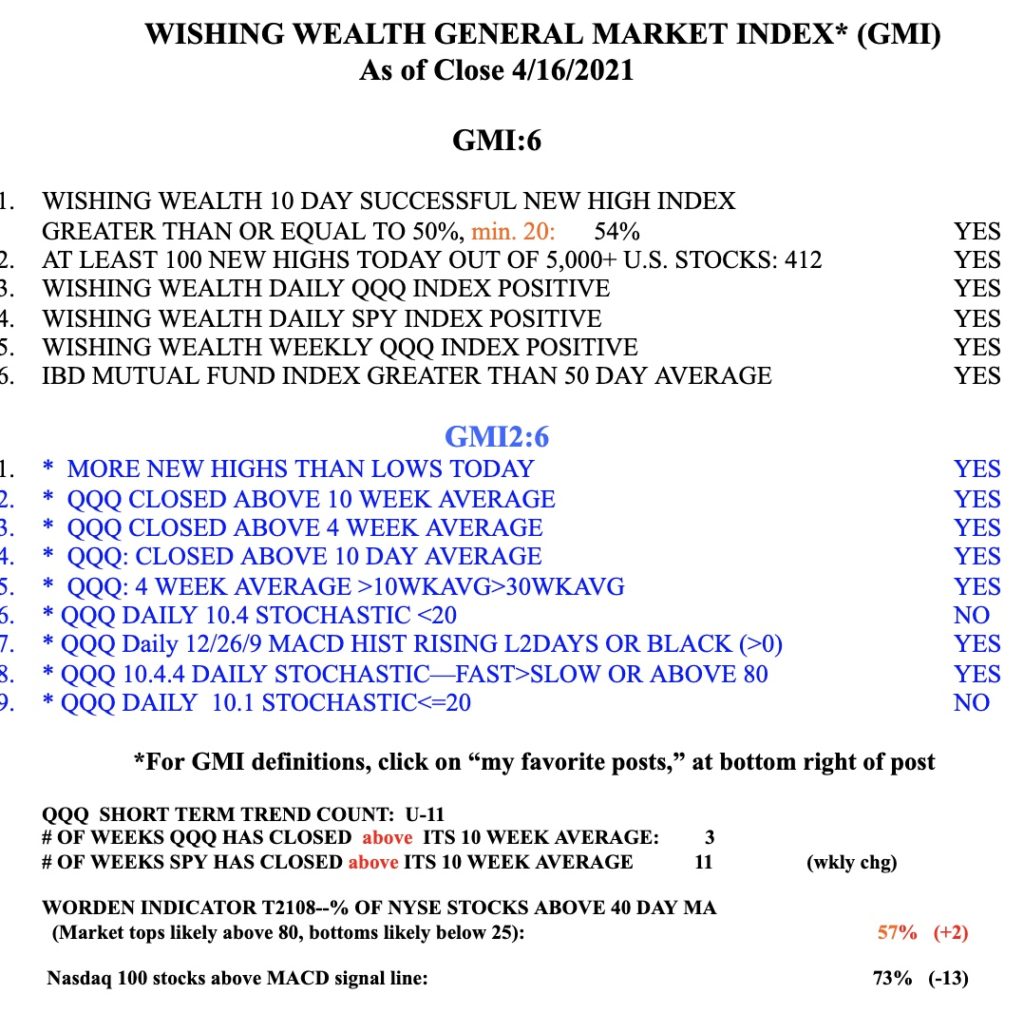
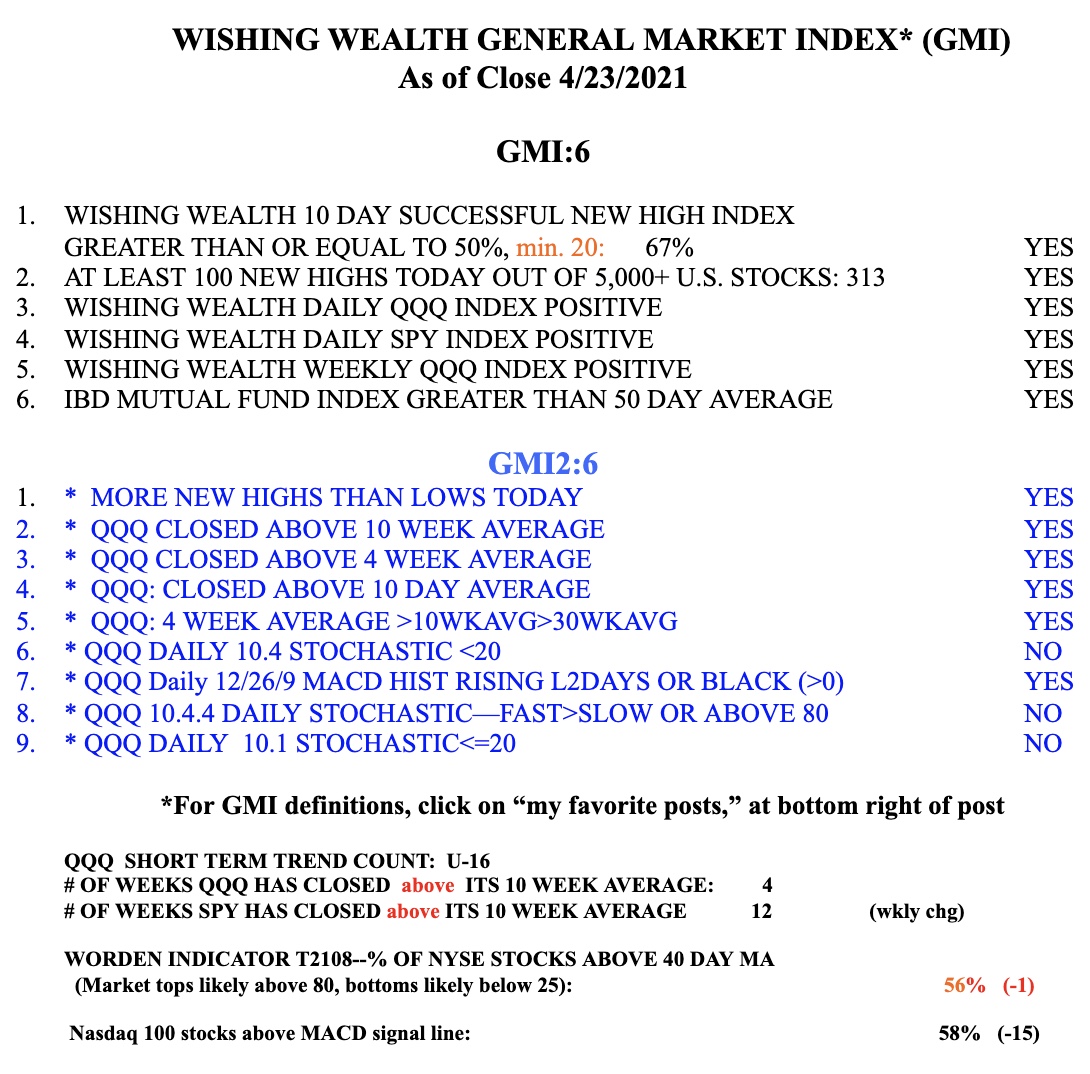
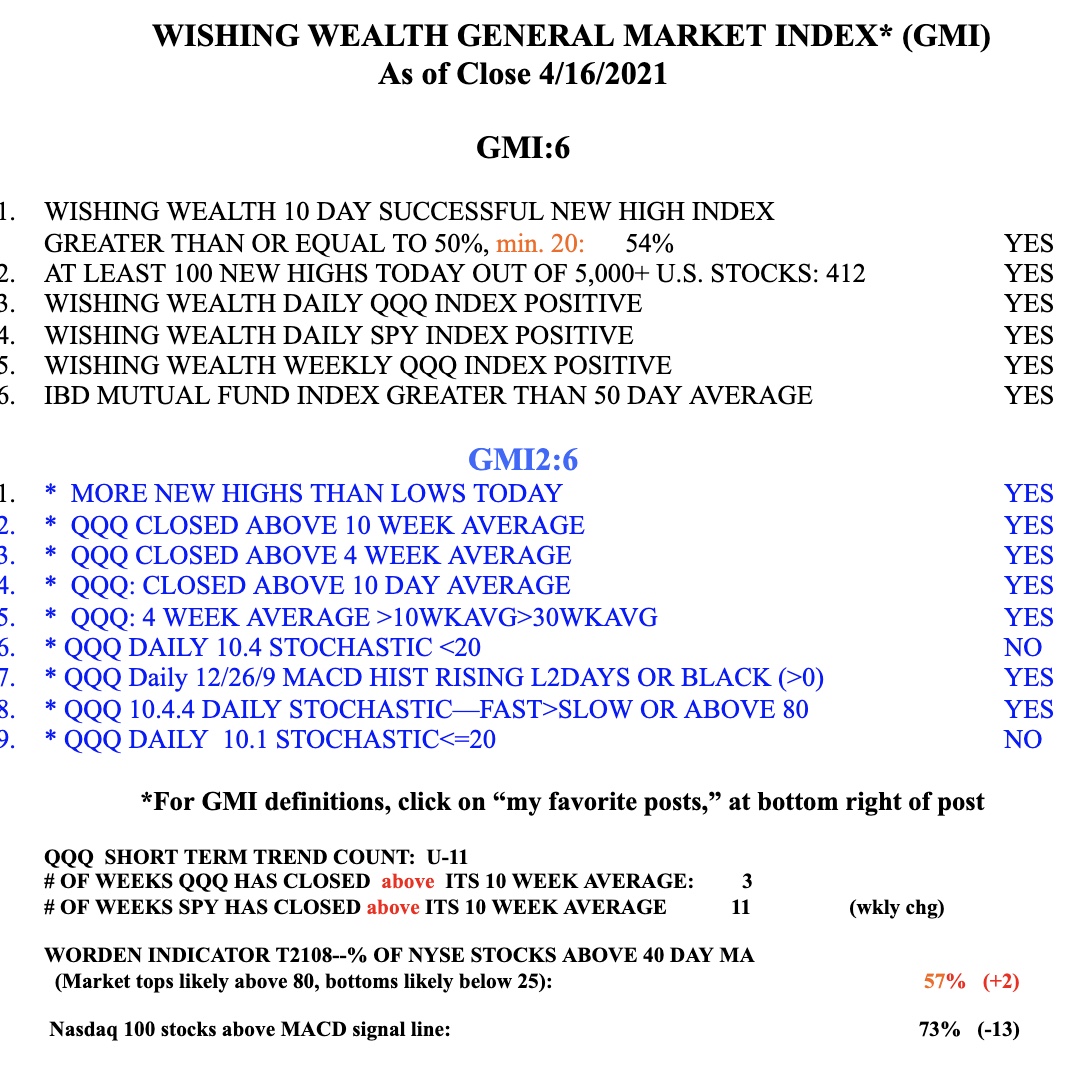
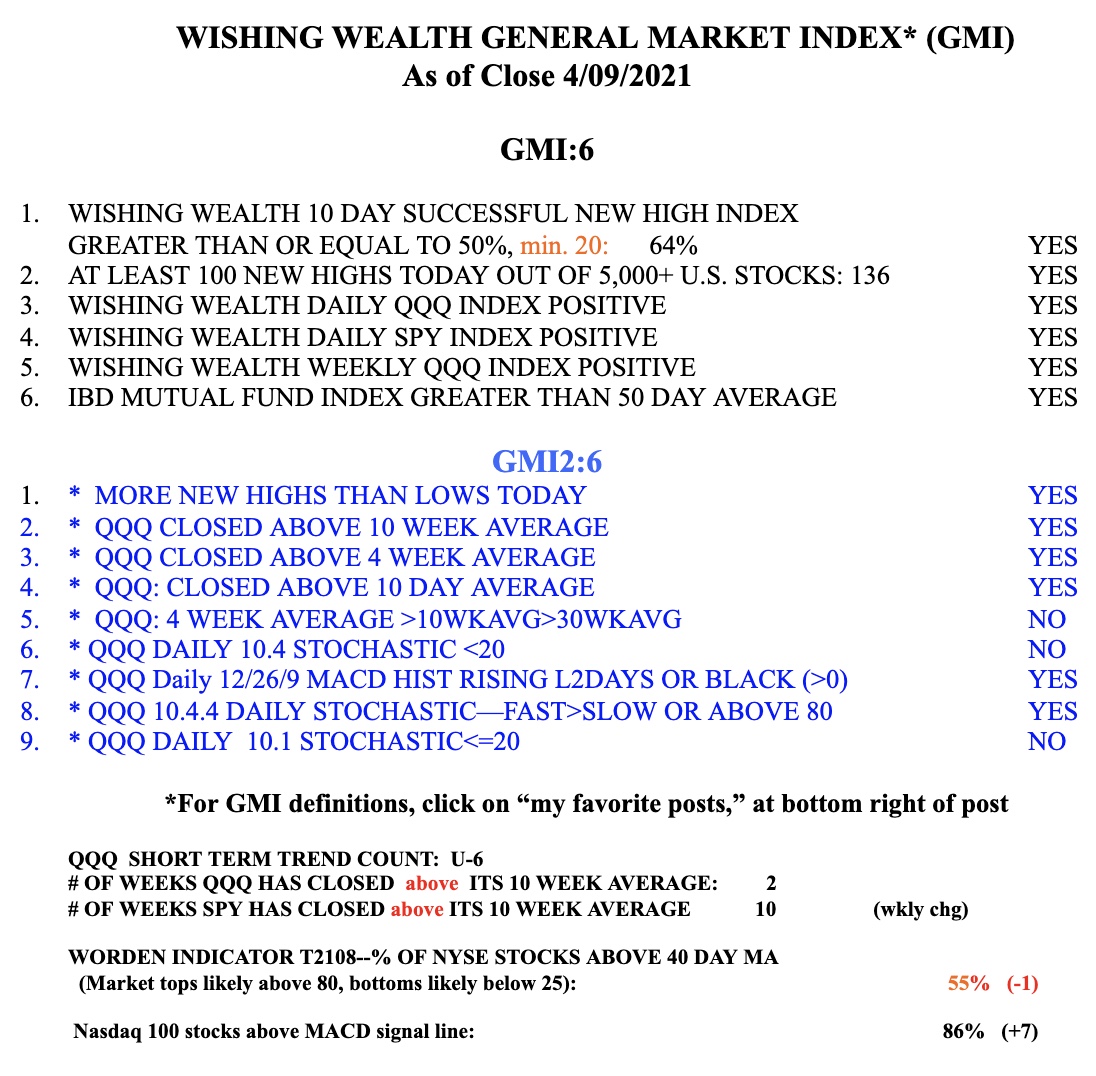
The GMI is at 6 (of 6) and remains Green.