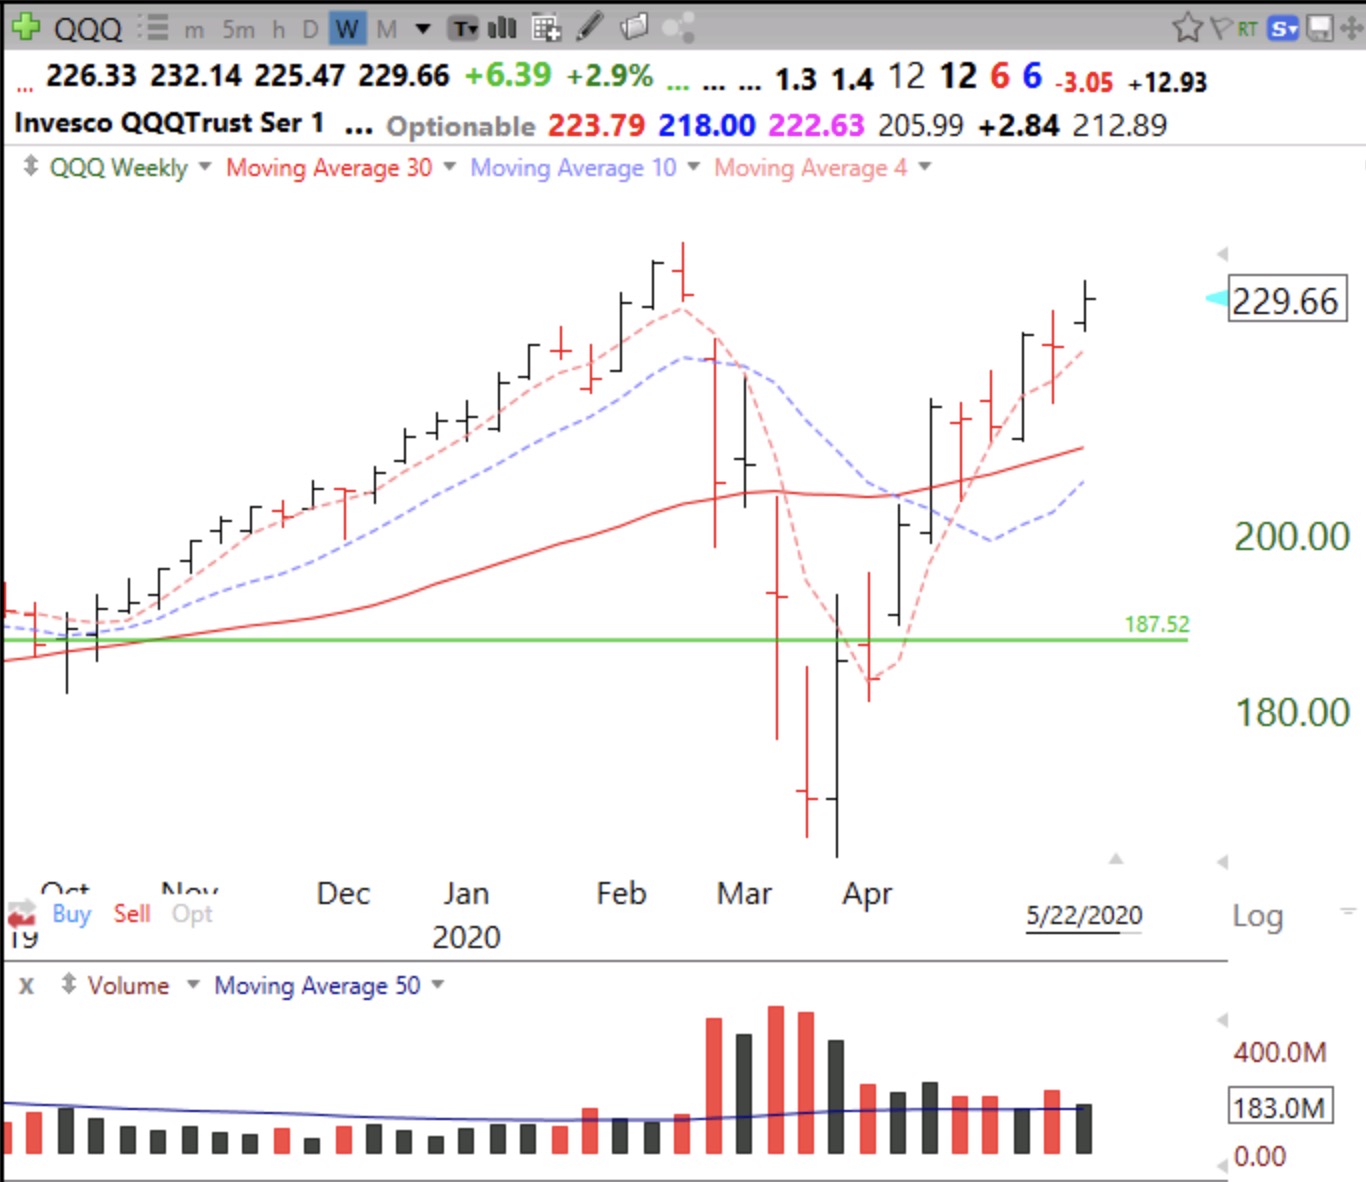
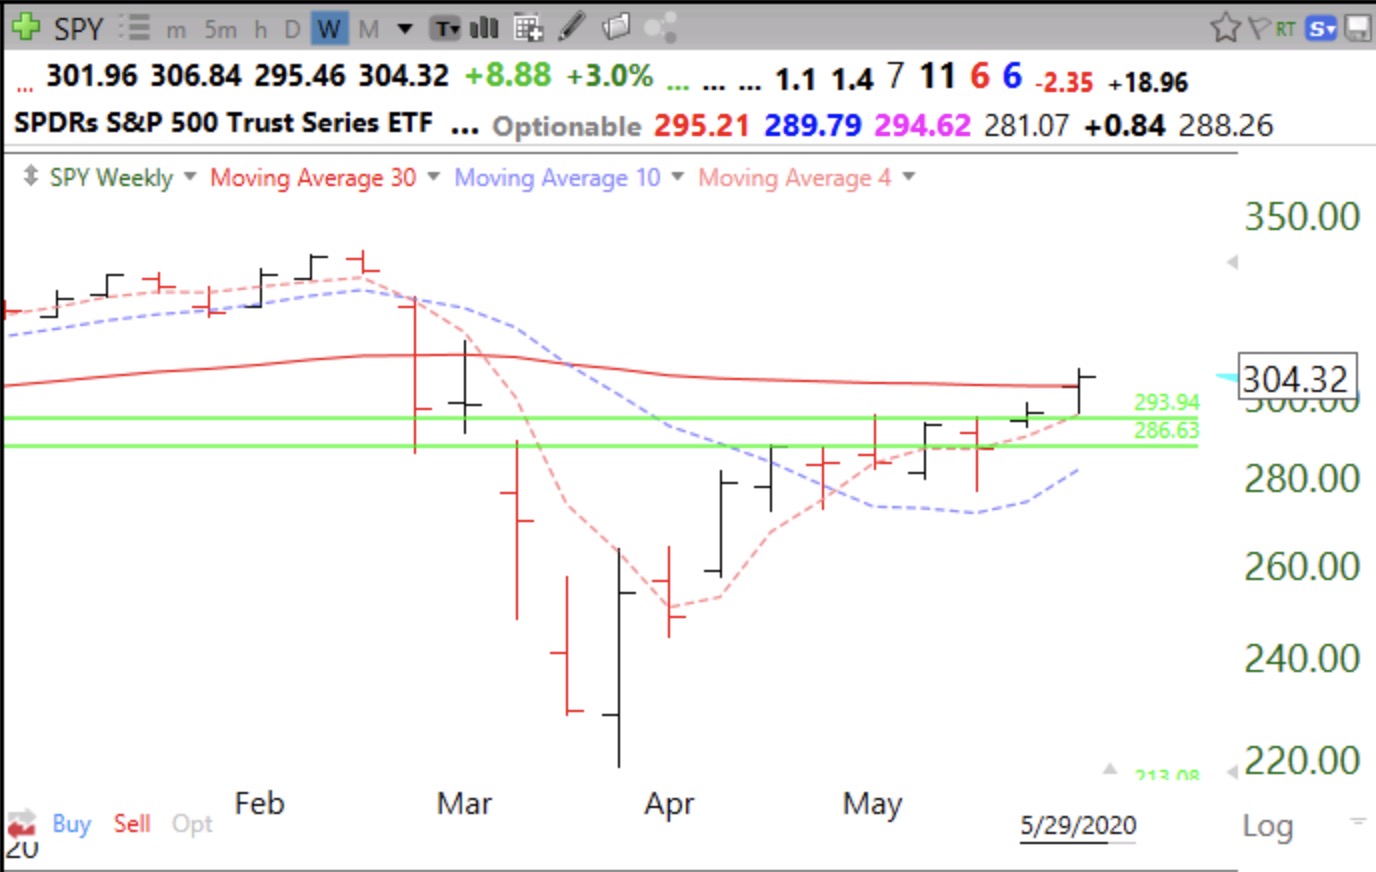
With the 4wk and 10 wk averages rising and the index above its 30 week average, it looks like SPY is forming an up-trend. I have started transferring my pension funds back into mutual funds. Once 30 week average curves up, indicating Stage II up-trend, will transfer rest into market.
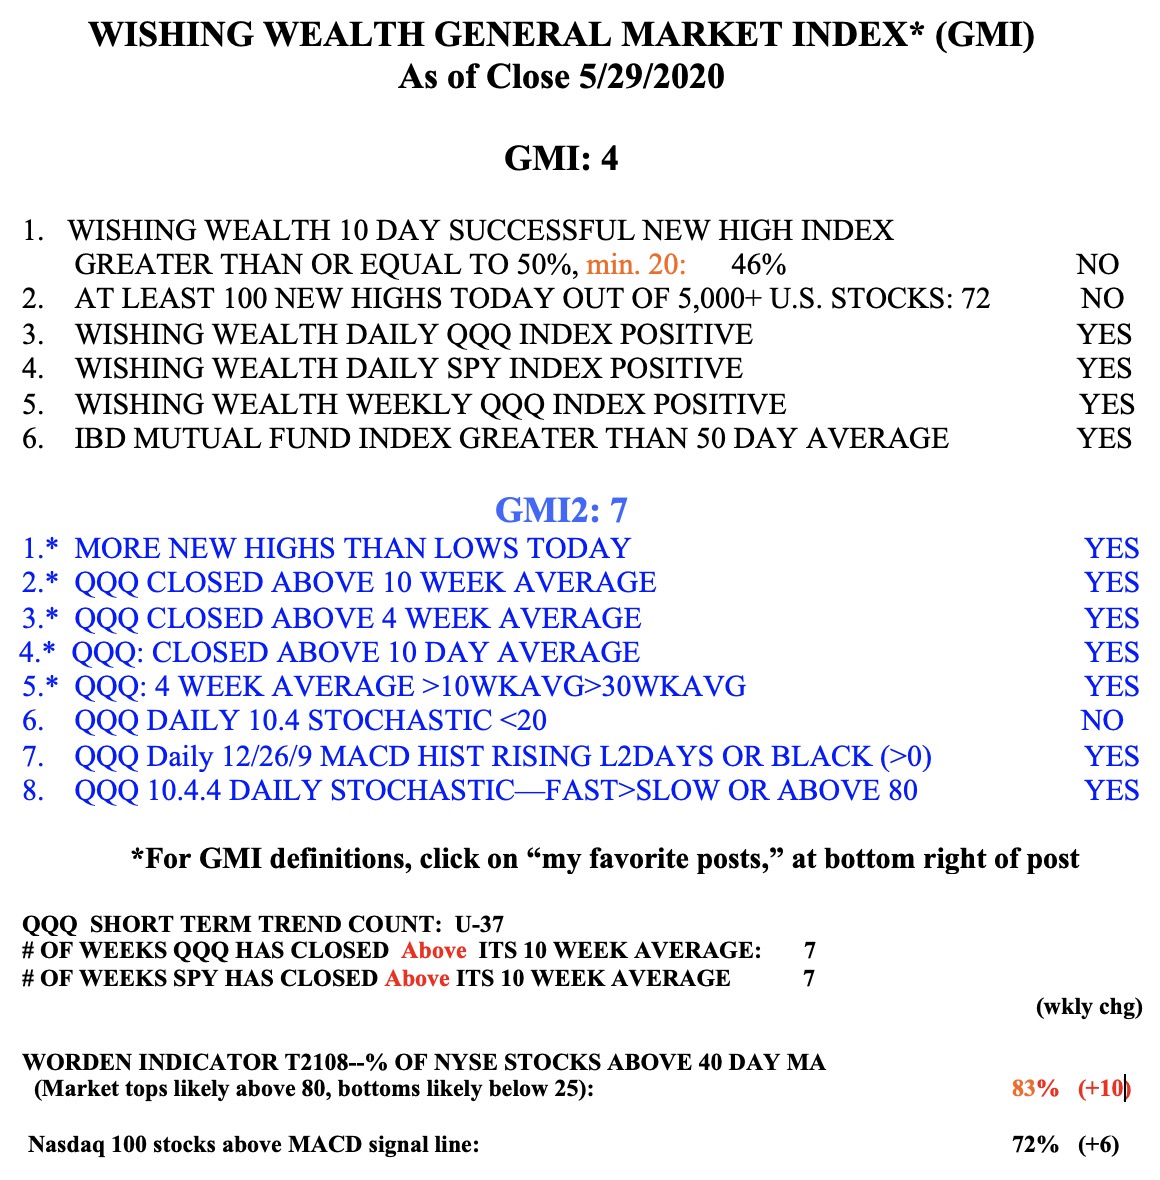
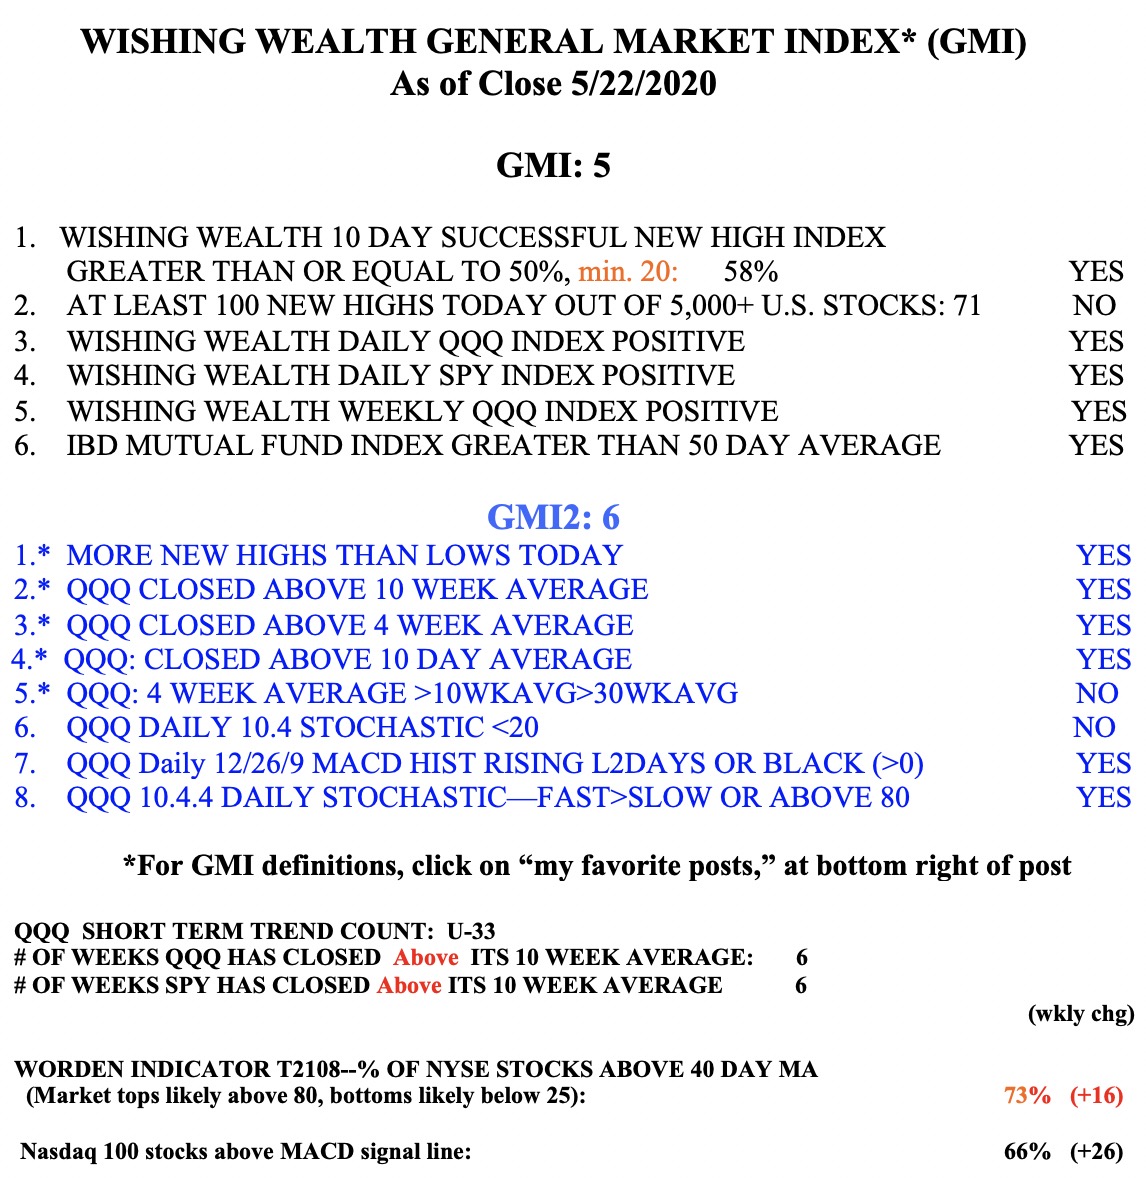
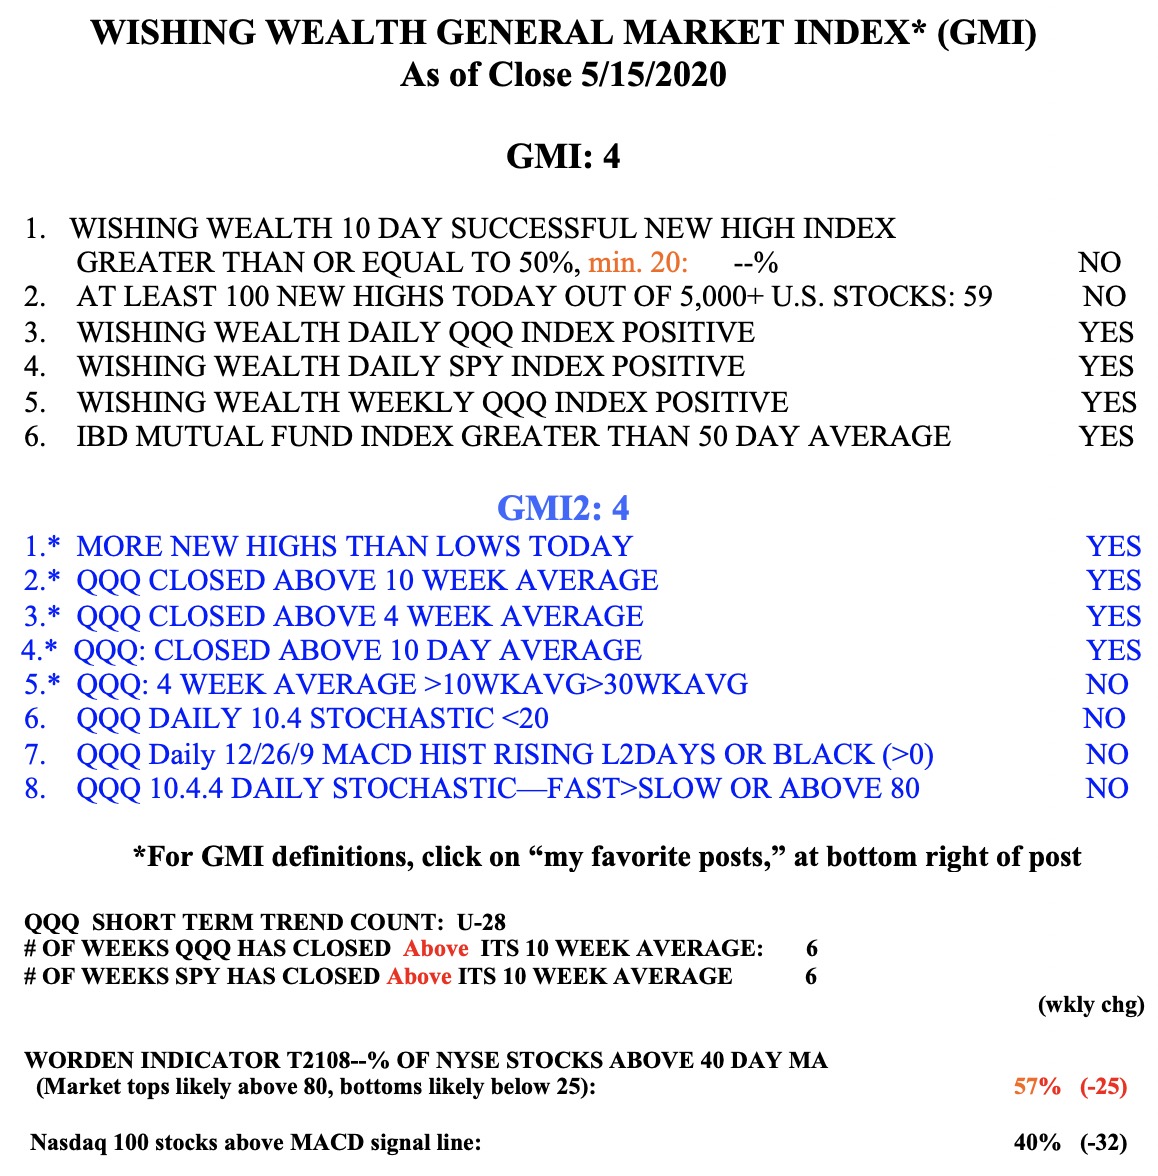
The GMI remains on a Green signal. Limited number of stocks hitting new highs and few successful new highs are keeping total to 4 (of 6).