On Saturday, I had the opportunity to present for 2.5 hours at the Worden software work-shop. I showed the audience how I use TC2007 to manage my trading. It was gratifying to see the warm reception I received from a local, primarily older adult group. I just finished two courses at the university and have been accustomed to lecturing to college students. It was a new experience for me to present to a class of people who were their parents’ ages. A big surprise was that my star student from three years ago surprised me by attending the work shop and told me that when he graduates in a few weeks, he will move to California to open up his own mutual fund. The year after he completed my course, he made a lot of money buying put options (betting on a decline) on USO during its dramatic decline in 2008, from over $100 to around $22. So the afternoon presentation was an exciting time and most of the 120 attendees said they would take my course on the market if it were ever offered more widely………
The market action last week spooked a lot of people. My account actually rose on bizarre Thursday, with my position in TYP. This is now a good time for me to be in cash on the sideline. The GMI and GMI-R are both back to one. The only indicator that is still positive is my weekly indicator of the QQQQ. 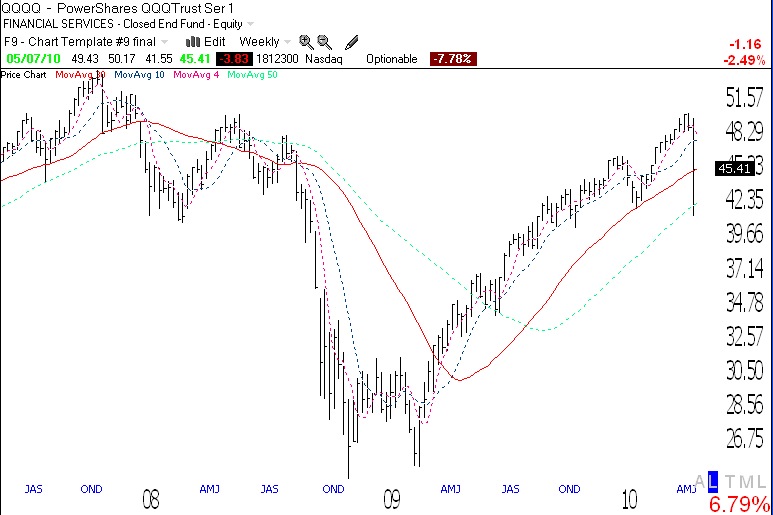 The QQQQ remains in a Stage 2 up-trend (see weekly chart of QQQQ), as defined by Stan Weinstein (see his book to right). So, in my trading account I am short and mainly in cash. In my university pension I remain fully invested in mutual funds. I only transfer my pension funds to cash when the weekly trend enters a Stage 4. By that time, the 30 week average will have curved down. I have successfully avoided past major down-trends by getting out at the beginning of a Stage 4. Note that the QQQQ closed right on the 30 week average (red). As long as the 30 week average continues to rise, I will ride this up-trend in my pension account.
In spite of the short term down-trend in the QQQQ, I do not think this is the time for me to begin to short stocks in my trading account. This is because the Worden T2108 indicator, at 15%, is already in an area where prior bottoms have occurred. If this indicator, which declined from 64% last Friday, should hit single digits this week, I would be looking for a bottom. I might even buy some QLD (ultra long QQQQ ETF), if that occurs. Every time I have said this, I get scared when the T2108 hits such a depressed level. 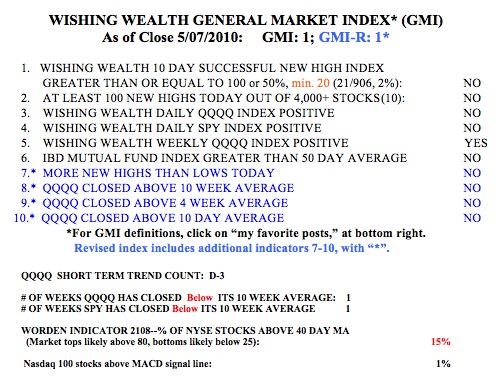 This time I will try to take advantage of a further drop into such an extreme level. The T2108 touched 6% at the re-test of the bottom in March, 2009, and 1% at the panic bottom in October, 2008. These were extreme readings, however, not seen any other time in the past decade. Friday was the third day of the new QQQQ short term down-trend. I will be more certain of this new down-trend if it lasts for 5 days. Once we pass that point, trends tend to last for a while. Note that only 1% (1) of the Nasdaq 100 stocks closed with its MACD above its signal line, another sign of short term weakness. For the first time since February 4th, there were more new 52 week lows than highs (46 vs. 10) in my universe of 4,000 stocks. This is not the time for me to be buying stocks at new highs.
I looked at the performance of the IBD 100 list published on Monday, 4/12/2010. Since these stocks closed on 4/9, only 17% have advanced through last Friday. Put another way, during this period the QQQQ has declined 7.4%, while more than half of the IBD100 stocks declined 9.5% or more. Growth stocks tend to go up more in up-trends and decline more in down-trends, as traders take profits. For example, since 4/9 to 4/26 when the QQQQ topped, 50% of this IBD100 list advanced 4.9% or more, while the QQQQ increased only 2.8%. So I continue to concentrate my buying in IBD100 stocks, but only in QQQQ short term up-trends (within a longer term up-trend).
By the way, remember I ran my submarine scan on 4/29? Well, since then, all nine of the stocks that came up have declined, as did all of the Nasdaq 100 stocks. Three of the nine (33%), however, are down 17% or more, during a time when the QQQQ declined by 9.6%, but only 5% of the Nasdaq 100 stocks declined 17% or more. So,at least that time, the submarine scan did select stocks with a greater likelihood of sinking more during this period.
Remember, one must trade with the trend in order to maximize the chances of success. Right now, the short term trend is down, and I will not go long. (The longer term trend is still up (Stage 2), so I will keep my pension invested in mutual funds and continue to dollar coast average in with new contributions, until it looks like Stage 2 is over.) I trade like a chicken, run from a down-trend, and conserve my capital to trade only when the odds are in my favor.