I started teaching two classes on technical analysis last week and will explain more of my concepts and include informational links, as many students will be new readers. My General Market Index (GMI) keeps me trading with the general market’s trend. The GMI is a count of 6 short and long term indicators. Because I like to trade growth stocks, the GMI focuses largely on the NASDAQ 100 stocks, as measured by the ETF, QQQQ. The Successful New High Index measures whether stocks that hit a new high 10 days ago have risen since that time. Since I trade stocks at or near new highs, I also like there to be at least 100 new highs in my stock universe of roughly 4,000 actively traded stocks above $5. My daily QQQQ and SPY indicators measure these indexes’ short term trends. The weekly QQQQ indicator is my measure of the longer term trend. Weekly charts provide me with a more interpretable and reliable picture of the market’s trend. Finally, my IBD Mutual Fund Index indicator tells me how well growth funds tracked by IBD are doing. If funds that invest in growth stocks are doing well, I am also more likely to make money trading growth stocks. I subsequently added four more indicators to the GMI in the form of the GMI-R (revised). The added indicators count whether there are more daily new highs than lows, and how the QQQQ has performed in relation to three moving averages. I become very defensive in my trading portfolio when the GMI is less than 4 and consider going to cash. When the GMI goes to zero, I also start going to cash in my more conservative university pension account, which allows me to trade its contents only a few times each year. So, with the GMI currently at 1,
IBD
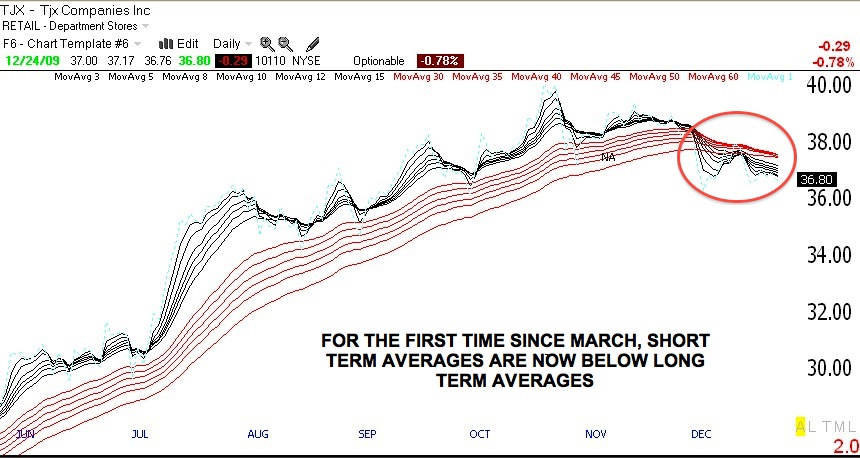
My post from the bear market bottom; weak TJX; GMMA shows QQQQ in strong up-trend
“Last week, a person who knows nothing about the market asked me how to short stocks. This is reminiscent of the stories of the shoeshine boys providing stock tips, near the roaring 20’s market’s top. The sentiment is just too negative right now. Does this mean the market has to turn up? Not necessarily, but the market is always an assessment of competing probabilities. “ (Post on 3/8/2009, GMI: 0, T2108: 7%)
I wrote the above words last March, which turned out to be just as the market successfully tested its bear market lows and began the current rise. The Worden T2108 indicator was in single digits, a rare screaming oversold buy signal. When people around me who never traded asked me how to short stocks it turned out to be a key contrary signal that the market decline was near an end. Similarly, I remember when a friend who knows little about the market asked me if he should refinance his house to invest in the market–back in 2000 near that market’s top………
I have noticed that the pundits have been saying that TJX , the discount retailer chain, is a good buy. I therefore was struck by the GMMA daily chart below, which is flashing warning signals. With the short term averages (black lines) now below the longer term averages (red), this is not a stock I would want to own. It may even be a good short play. You do know that analysts sometimes tout a stock so that their big clients can unload their long positions to the unsuspecting public. (The “NA” on the chart shows when IBD wrote about TJX in its New America column.) Another stock with similarly weak technicals is PWRD.
Meanwhile, the GMI and GMI-R
Some new rocket stocks to watch
I used TC2007 to scan the market for stocks that meet my most stringent fundamental and technical criteria for rockets. These stocks have great fundamentals and technicals, have already doubled their price a year ago and are near 5 year or all-time highs. I have listed in this table the 11 stocks out of 4,000 in my stock universe that met these criteria. 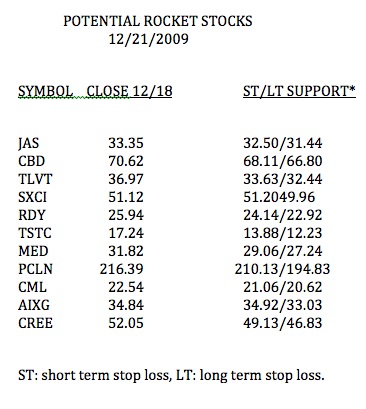 All of these stocks had last quarterly earnings up at least 100%. Coincidentally, all but 4 of the 11 are in my records as having appeared on the IBD100 and/or IBD New America lists during the past year. I have also noted in this table where I might place long term or short term stop losses on each long position. The most conservative stop loss is the short term support level. With a growth stock I rarely retain a long position if the stock closes below its short term support level. However, if I bought near long term support I might use the LT support level as my exit strategy. I will return to these 11 stocks in a future post to show you how they behaved. These stocks have already proven themselves as being in strong up-trends, but one never knows when an up-trend will end. That is why I immediately enter a sell stop or buy a put option for insurance, after buying one of these high momentum stocks. I currently own 3 of these stocks.
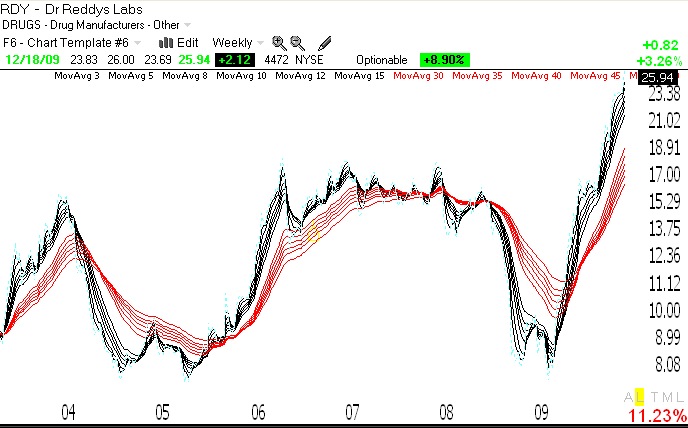
Below is a Guppy Multiple Moving Averages (GMMA) weekly chart (click on chart to enlarge) of one of these rocket stocks, RDY. Note how all of the shorter term averages (black lines) are well above the rising long term averages (red lines). This is the type of technical strength I seek in a potential rocket stock.
Meanwhile, the GMI and GMI-R remain at their maximum levels.