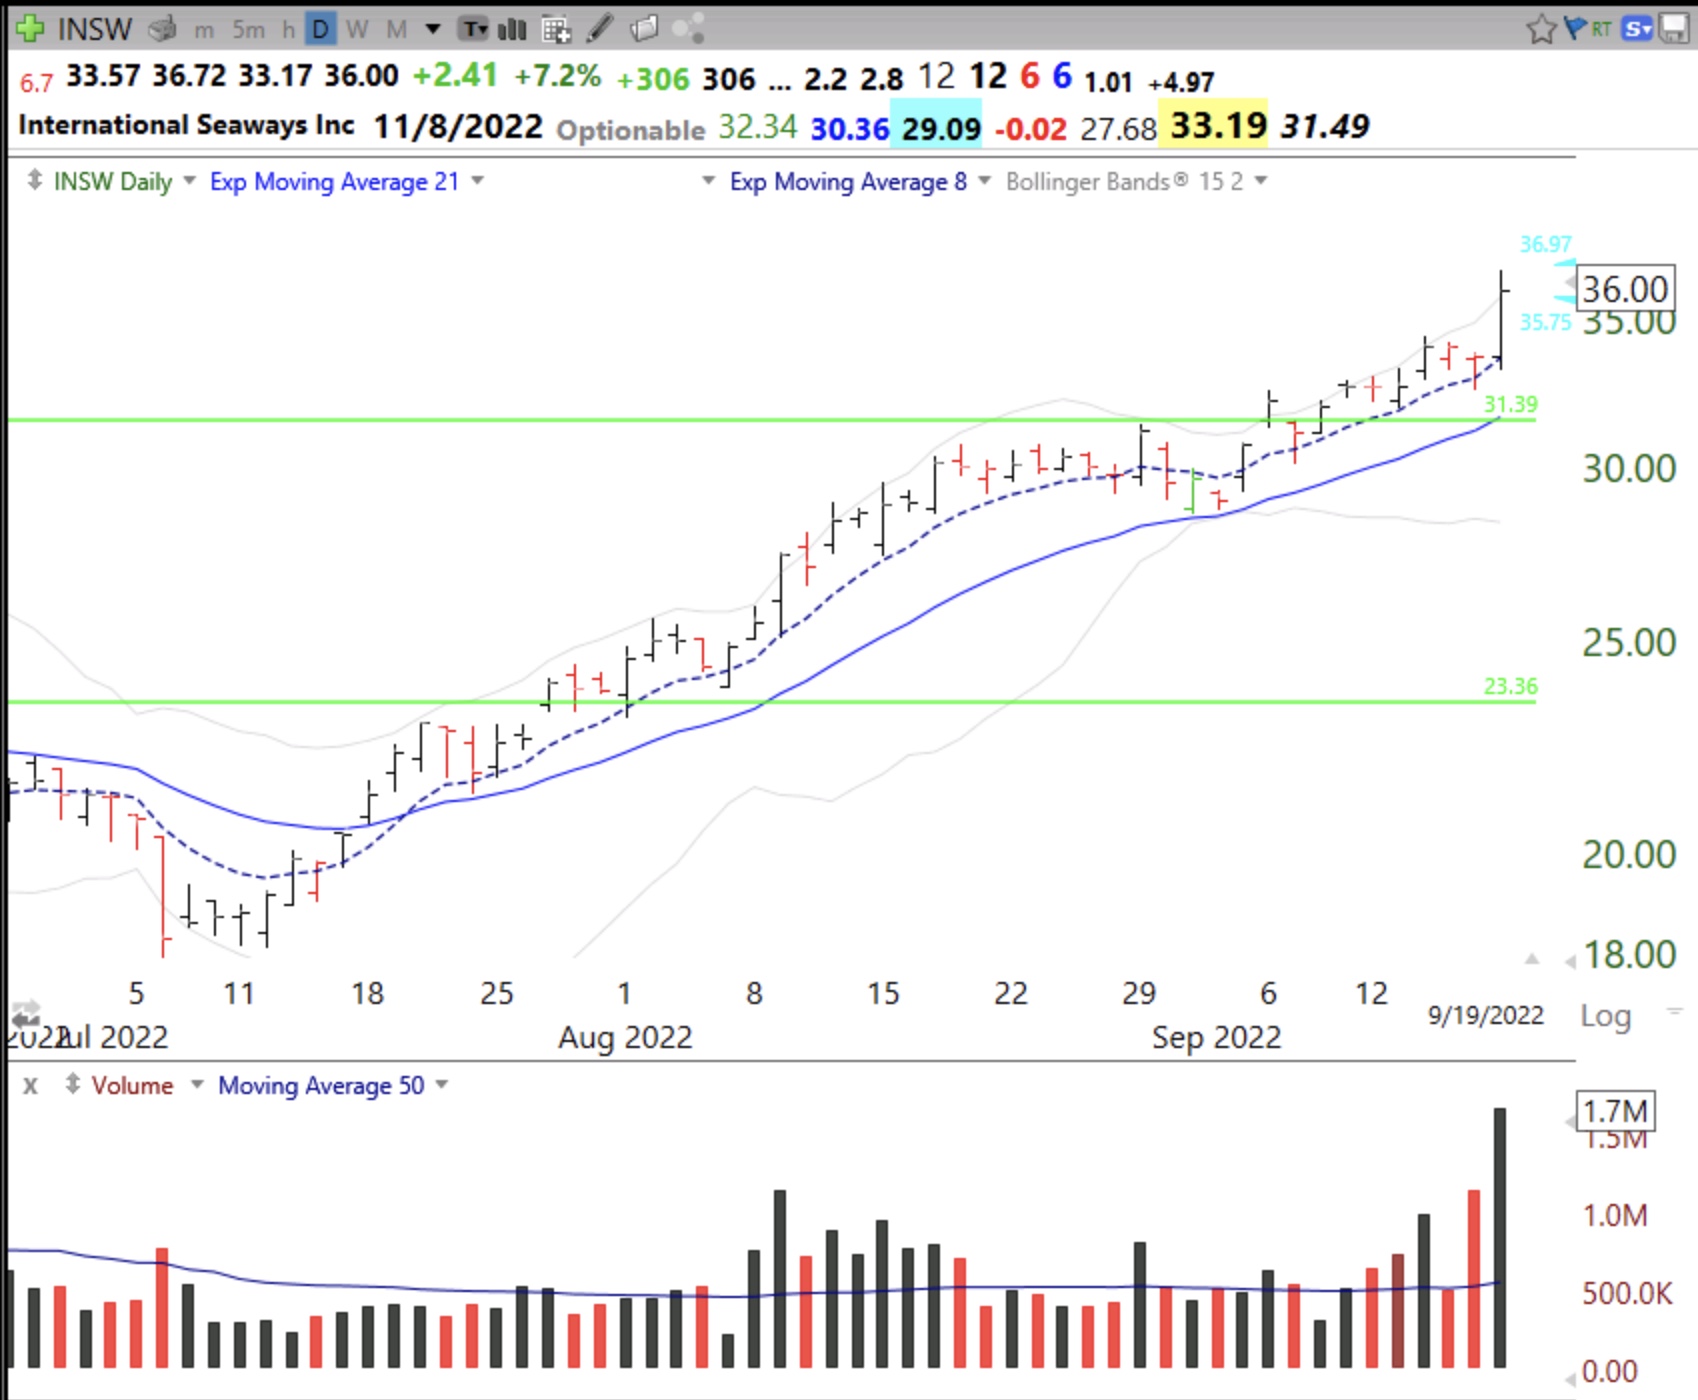
I am writing this post to show my students a way to evaluate a company that comes to one’s attention because of strong technical action. TC2000 showed me that INSW is one of four stocks that hit an ATH on Monday and that it came public in 2016. INSW had a GLB with above average volume on 9/6, closed below its green line the next day and retook it on 9/8. It advanced to a new ATH on Monday with the highest daily volume since last April. Note how INSW has found repeated support at the 8 day exp average (blue dotted line), which has been climbing above the 21 day exp avg. since mid-July. Its price has doubled from a year ago, a nice sign of technical strength.
MarketSmith shows the company to have a composite rating=98, Acc/Dis=A+ and group RS=98. While it has not made a profit yet, sales were up triple digit the last two quarters, fund ownership is climbing and expected earnings per share this year are $5.03. This shipping company is becoming profitable with a projected P/E ratio around 7. If I made a pilot buy today I would place my sell stop below today’s or yesterday’s low. Any stock that can come through this market at an ATH is showing incredible relative strength.
Note the weekly RWB up-trend.
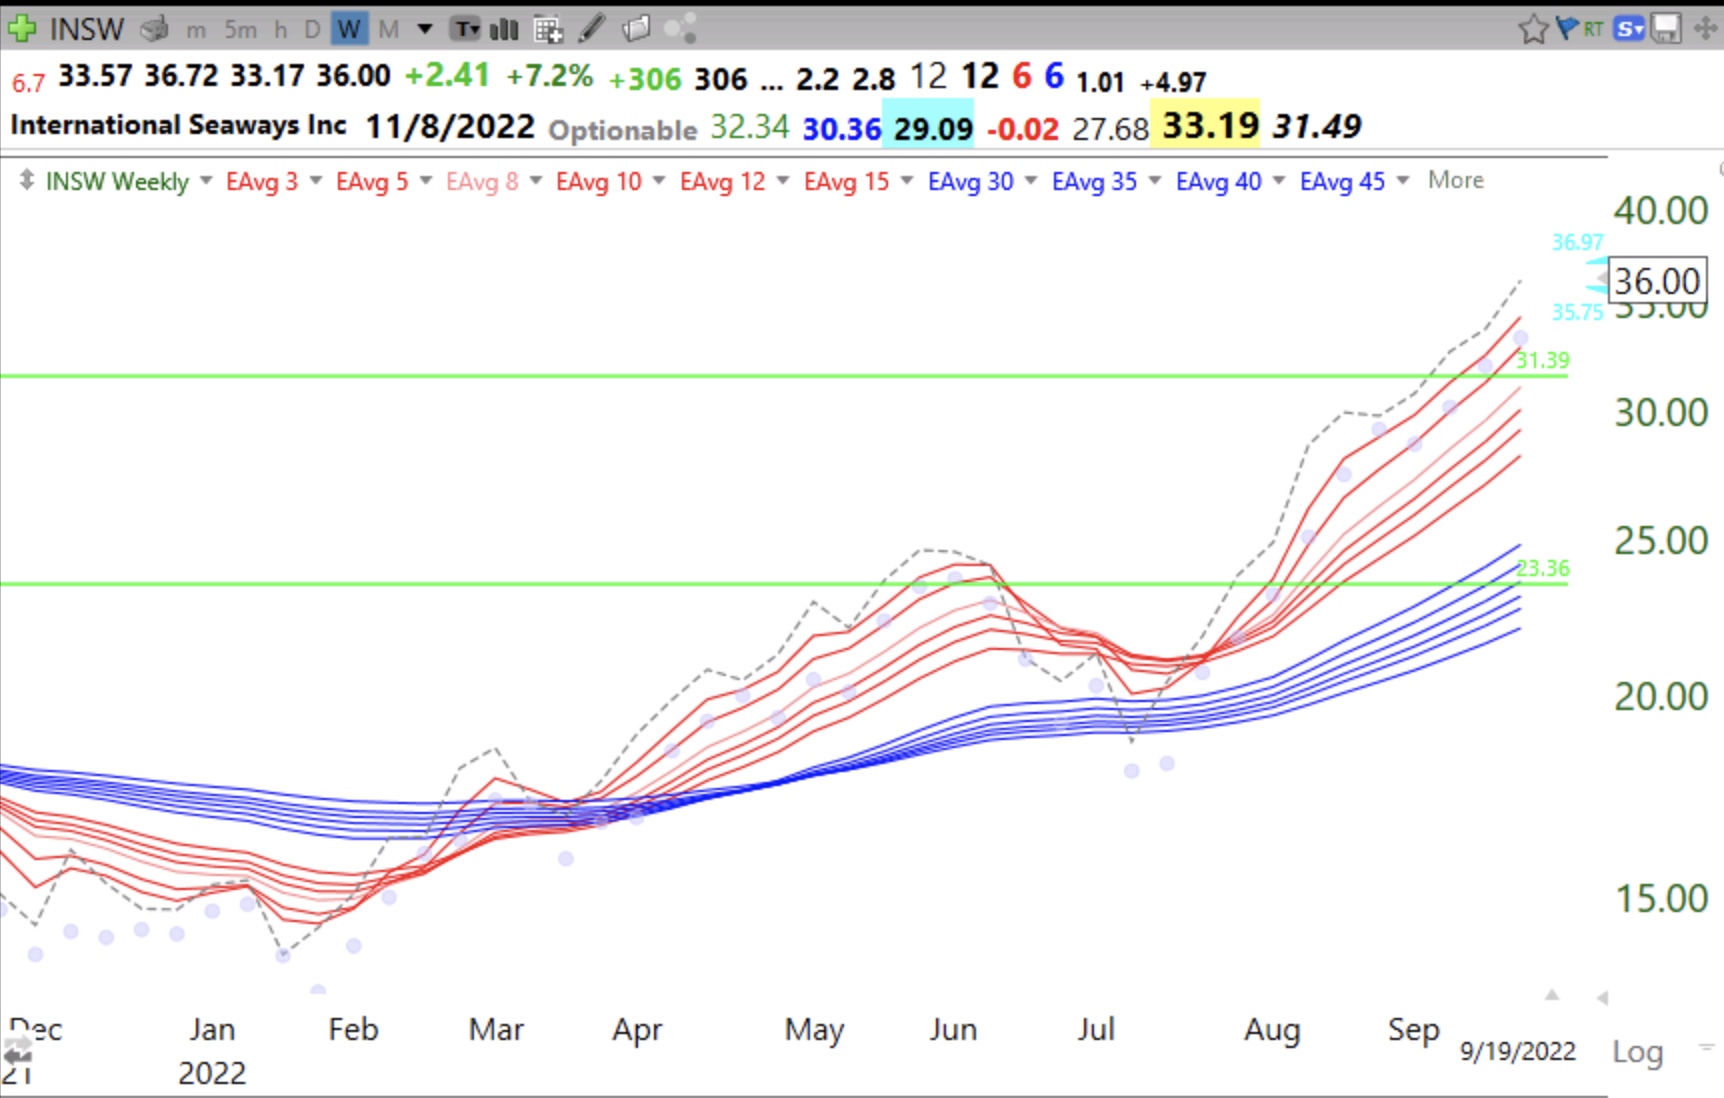
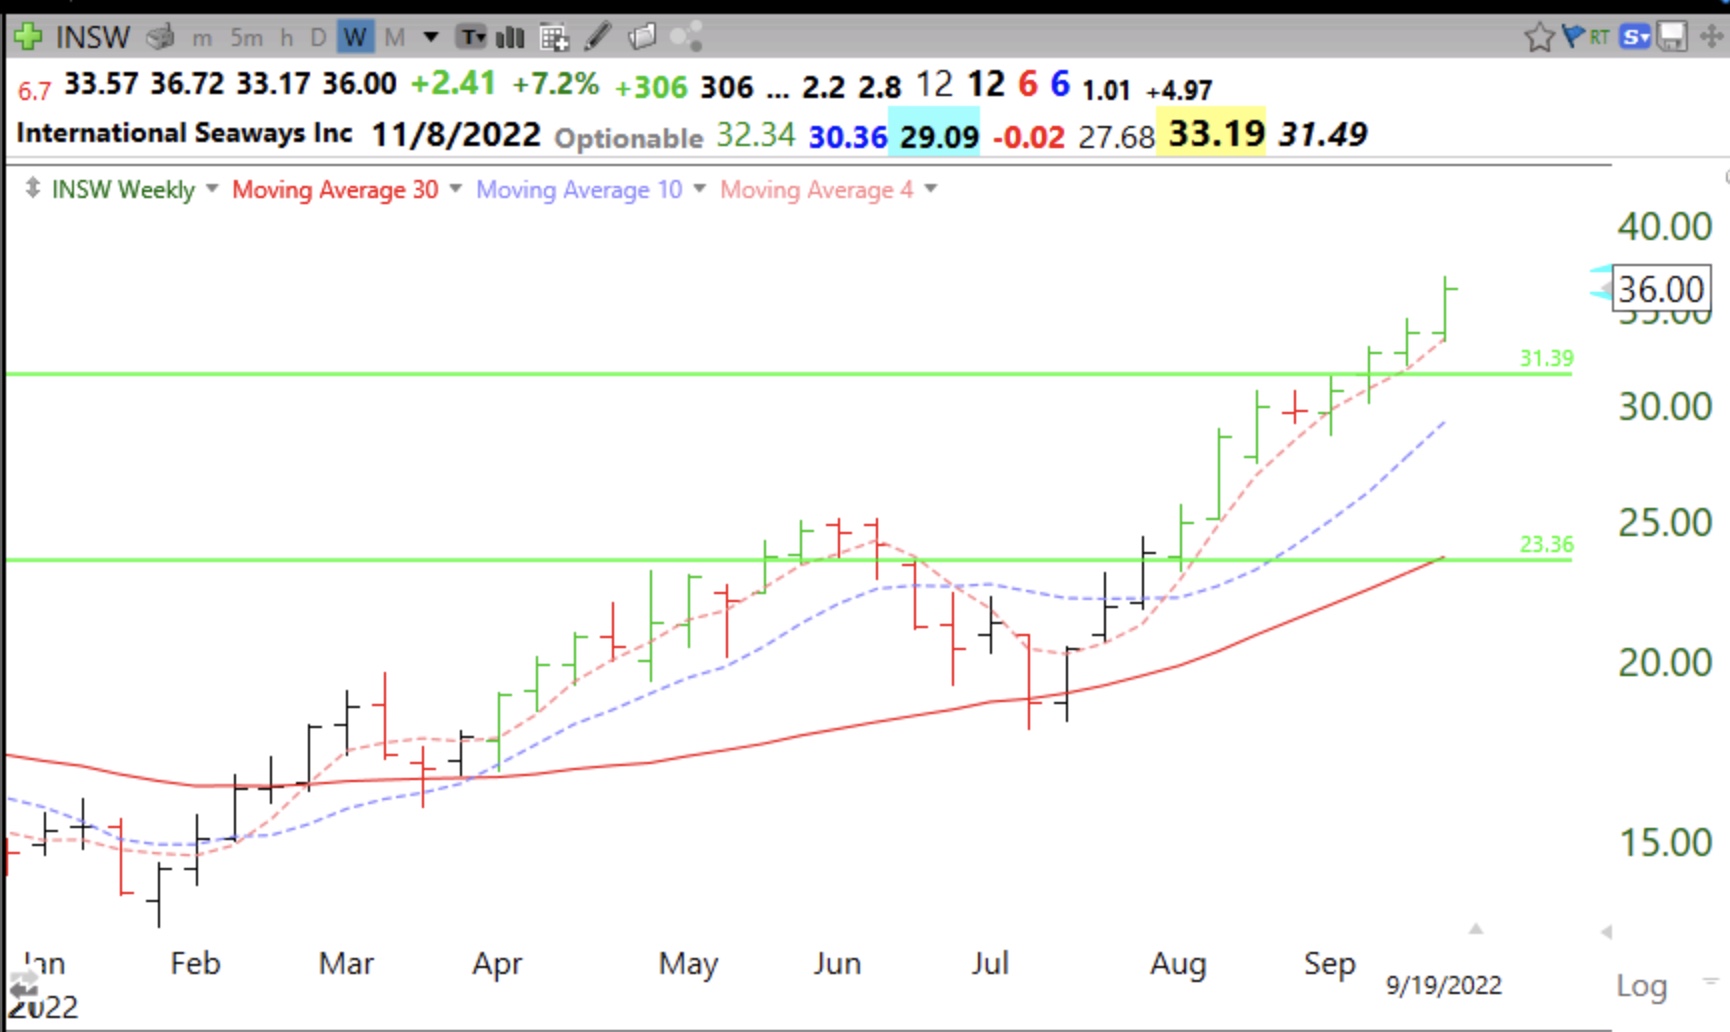
The weekly chart shows INSW is in a Stage 2 up-trend and closely following the rising 4 wk avg (pink dotted line). It has closed the last 11 weeks above this average–a sign of a rocket stock, as long as the 4wk>10wk>30wk averages.
what happened to LNTH?
Great analysis, thank you!
I thought that GLB = a dip of 3 (three) months from the old ATH?
Yes, I just checked .. your glossary says that GLB requires a pause of 3 months from the last ATH.
You are looking for a strong advance to an ATH and for the stock to close below that peak for at least 3 months. Then a new ATH on above average volume is desired.
Retesting 30 week average, be careful if it fails.