Blog Post: Day 3 of $QQQ short term down-trend; GMI=1 will likely flash Red signal on Monday; 642 new US lows Friday, most since the October low, IBD says market in correction; T2108 dives to 20%, $SPY back below critical declining 30 week average, see weekly chart

GMI1/6
GMI-22/9
T210821%

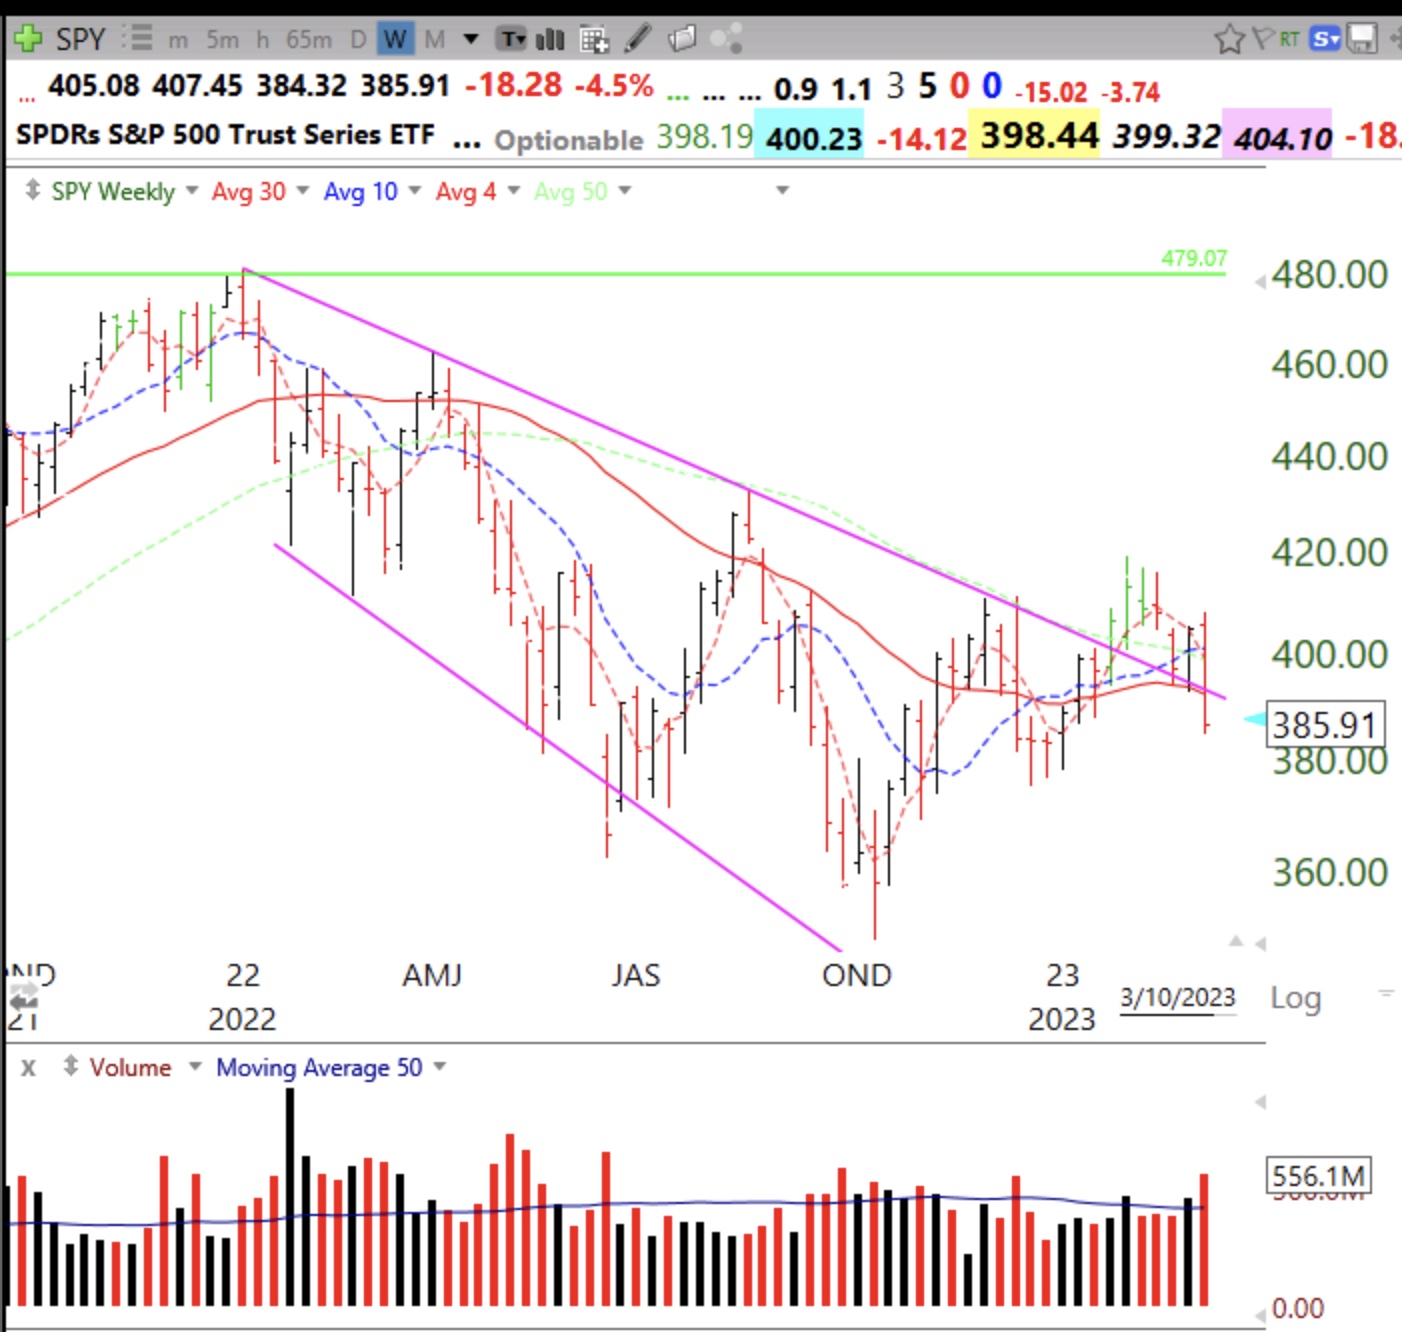
With the GMI at 1 (of 6), it is time to be on the sidelines in cash again. So many bullish set-ups failed last week. If T2108 declines to below 10%, I may buy a little SPY and only average up, slowly. But SPY looks quite weak now, below its declining 30 week average (red solid line), in a Stage 4 decline. Note the above average volume last week. This could portend a massive decline to the lower trend channel line, around 320. That is a worst case scenario, but with a major bank failing and a debt limit fight on the horizon………   But if to avoid a spreading bank panic the Fed slows its rate increases, we could see a huge snap back rally. The main positive technical sign I see is that the 10 week average (dotted line) remains above the 30 week average. Where that ends up will tell the story.

Blog Post: $QQQ short term down-trend could end Monday, the GMI is Green, Mr. Market appears to be getting ready to rally, compare current pattern with 10:30 weekly charts of bottoms in 2020, 2009 and 2002

GMI4/6
GMI-26/9
T210851%

After coming close to beginning a new longer term decline, the market appears to be getting stronger. MY QQQ short term trend indicator could turn up with a good day on Monday. This 10:30 weekly chart of QQQ shows its 10 week average (dotted line) is now above its 30 week average (red line). This pattern has been true for DIA and SPY for several weeks. This pattern of the 10 week above the 30 week typically indicates the beginning of a major longer term up-trend. The gray line is the weekly close. If the gray line  should return below the two averages and lead the 10 week below the 30 week it would likely signal the end of the new up-trend.

Here is the 2020 bottom.

And the bottom in 2008-9.

And the 2002 bottom.

The GMI continues to flash Green and is at 4 (of 6).


Blog Post: Day 30 of $QQQ short term up-trend, it may end Monday; 64 US new highs Friday and 176 lows; GMI close to turning RED, but I wait for signal–do not jump the gun

GMI4/6
GMI-23/9
T210848%

I will buy a little SQQQ if the QQQ short term up-trend ends on Monday. Most ominous is the fact that SPY has now closed below its 10 week average. Also, the 10.4 fast weekly stochastic has now crossed below the slow stochastic for SPY, DIA and QQQ. A weak day on Monday would likely reduce the GMI to 2 (of 6). Two consecutive days with the GMI below 3 would turn it Red. All of these technical indicators are picking up a possible change to down in the longer term trends. Many indicators are oversold and the market might hold and bounce. Wait to see!!!!