Blog Post: Day 26 of $QQQ short term up-trend; Weekly 10:30 charts show $DIA and $SPY turning around, but not yet $QQQ

GMI6/6
GMI-23/9
T210867%

This weekly chart of SPY shows the 10 and 30 week (red solid line) averages and the gray line shows the weekly closes. As long as the 10 week is above the 30 week average the market is in an up-trend. Note the closes are leading the index higher.

The DIA is even stronger.

QQQ is lagging but pointing upwards.

The GMI remains Green at 6 (of 6).


Blog Post: Day 21 of $QQQ short term up-trend; Only 70 US stocks at new highs and 63 at new lows on Friday, 11 at ATH; see list of top 20 stocks that passed my weekly green bar scan and chart of $ACLS

GMI5/6
GMI-24/9
T210871%

One of my favorite scans I created with TC2000 searches for a stock in a strong up-trend, at a  20 week high in relative strength vs. SPY,  that reached an ATH in the past 3 months and that has bounced up off of its rising 4 week average. If I buy one of these stocks I place my sell stop at the bottom of the weekly green bar, see the chart example of ACLS below this list. 29 stocks out of almost 7,000 passed this scan. I sorted the 29 by the amount each stock closed above its 250 day low (c/minl250, see last column). Here are the top 20. Seven of these stocks have at least doubled their low price. Stocks with a blue flag in the first column appear on my watchlist of recent IBD/MS stocks.


ACLS is an example of a weekly green bar stock. (I color green the weekly price bar all stocks that bounced up off of their 4 week average even if they did not survive all of the conditions in the scan.) Note how ACLS found support above its rising 4 week average (red dotted line) the  past 5 weeks. That is a pattern of a strongly advancing stock. A weekly close below the 4 week average would be the first sign of technical weakness and a warning that the rise may end. A weekly close below the 10 week average (blue dotted line) would be a sign for me to completely exit, if I owned it. Note the rising weekly volume as the stock has climbed. Also note the green line break-out to an ATH last week. ACLS  also follows my yellow band rocket stock pattern. According to MarketSmith, ACLS has Composite and RS ratings = 98.  The technicals tells me what to look at and when to enter or exit, but the fundamentals must also be strong.


The GMI remains at 5 (of 6) and on a Green signal. But note that my more short term and sensitive GMI2 components have weakened.


Blog Post: Day 16 of $QQQ short term up-trend; Buy $TQQQ on day 1 of this up-trend and it advanced through Friday, +29.5%, beating all but 4 of the Nasdaq 100 stocks and all but 3 of the S&P500 stocks–same incredible results again! See chart

GMI6/6
GMI-26/9
T210877%

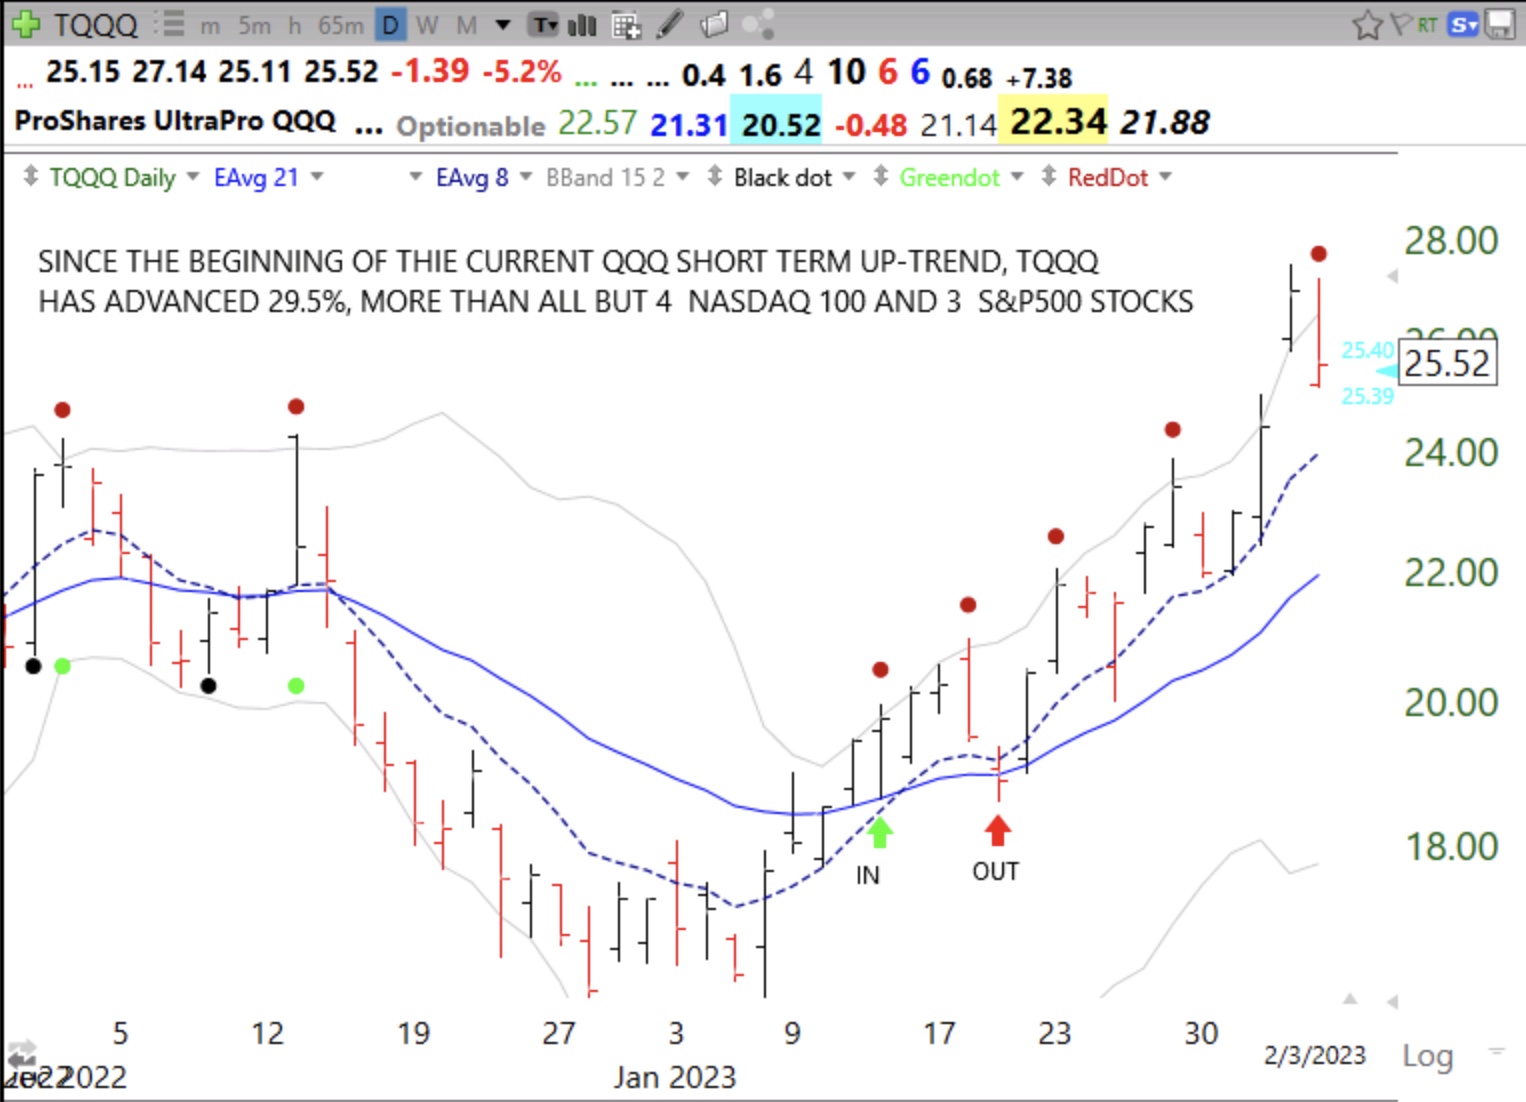
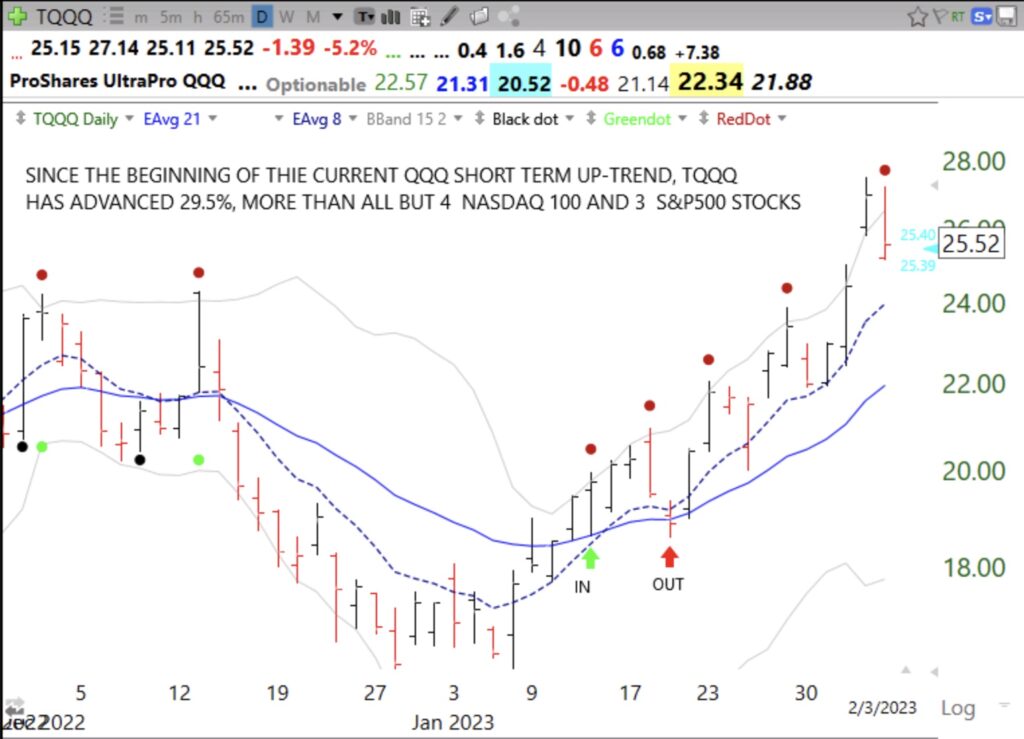
I confess I did buy some TQQQ at the beginning of the new QQQ short term up-trend (green arrow on chart) and posted about it, but allowed myself to get shaken out on 1/19  (red arrow) and did not buy back in. Not buying back in compounded my first mistake. I need to let my computer trade for me because I let myself be shaken out even though my objective rules said that the short term up-trend was still intact :-(. See the daily chart of TQQQ below.

TQQQ even beat all but 4 of the 668 stocks in my aggregate watchlist of recent IBD50 and MarketSmith Growth 250 stocks! If you search my blog on “TQQQ” you will find that I have replicated this analysis and found similar results for years. Maybe it just does not pay for me to try to find winning individual stocks when I can just buy the 3x leveraged ETF, TQQQ. By the way, I also found 16 leveraged ETFs that beat TQQQ!  TSLL, CONL and KOLD were each up over 80%! Remember, however, these leveraged ETFs fall much faster than the underlying index or security when the trend reverses down, so you need a really good exit strategy, especially one better than mine!


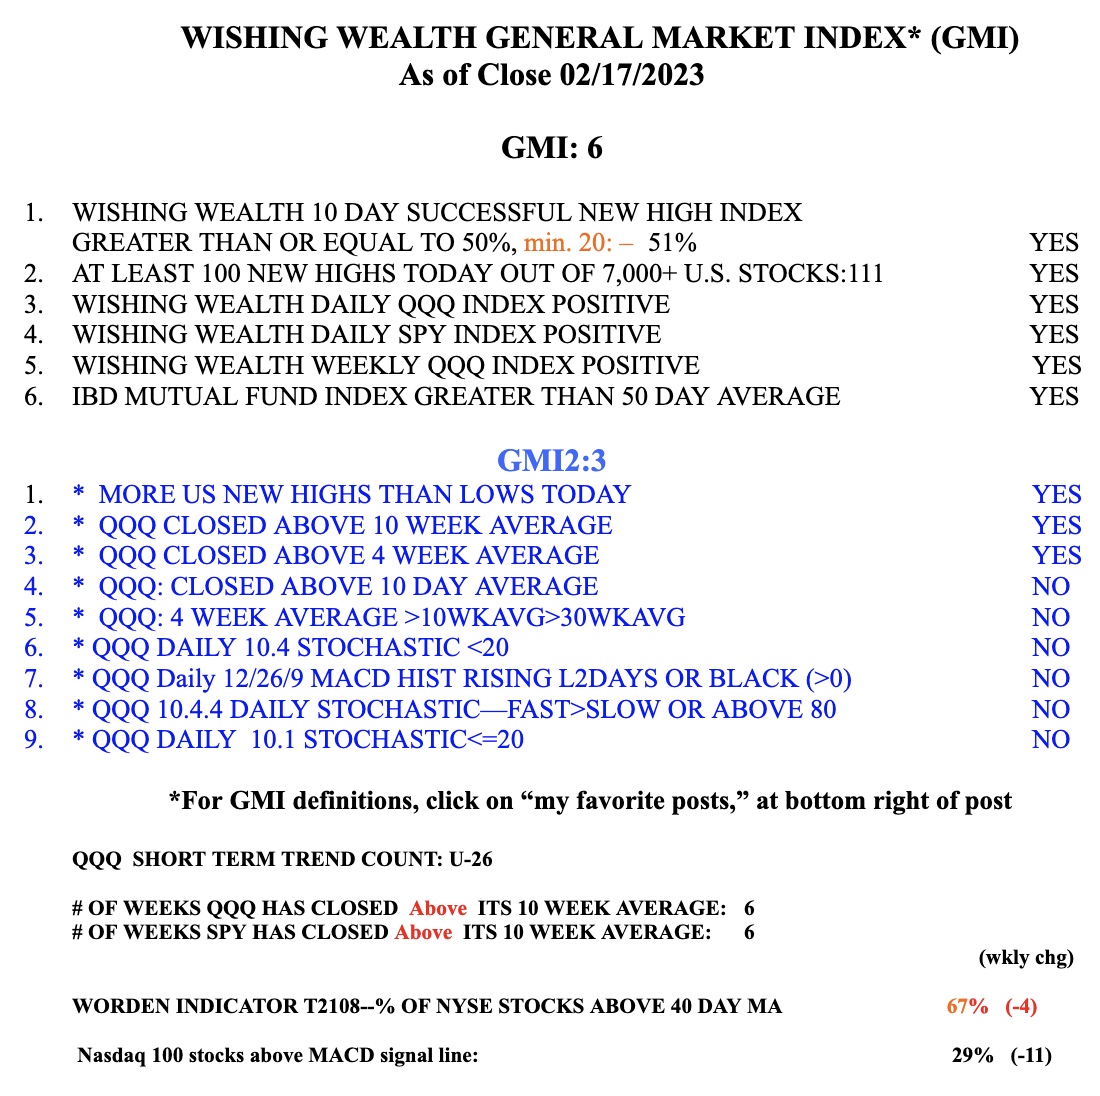
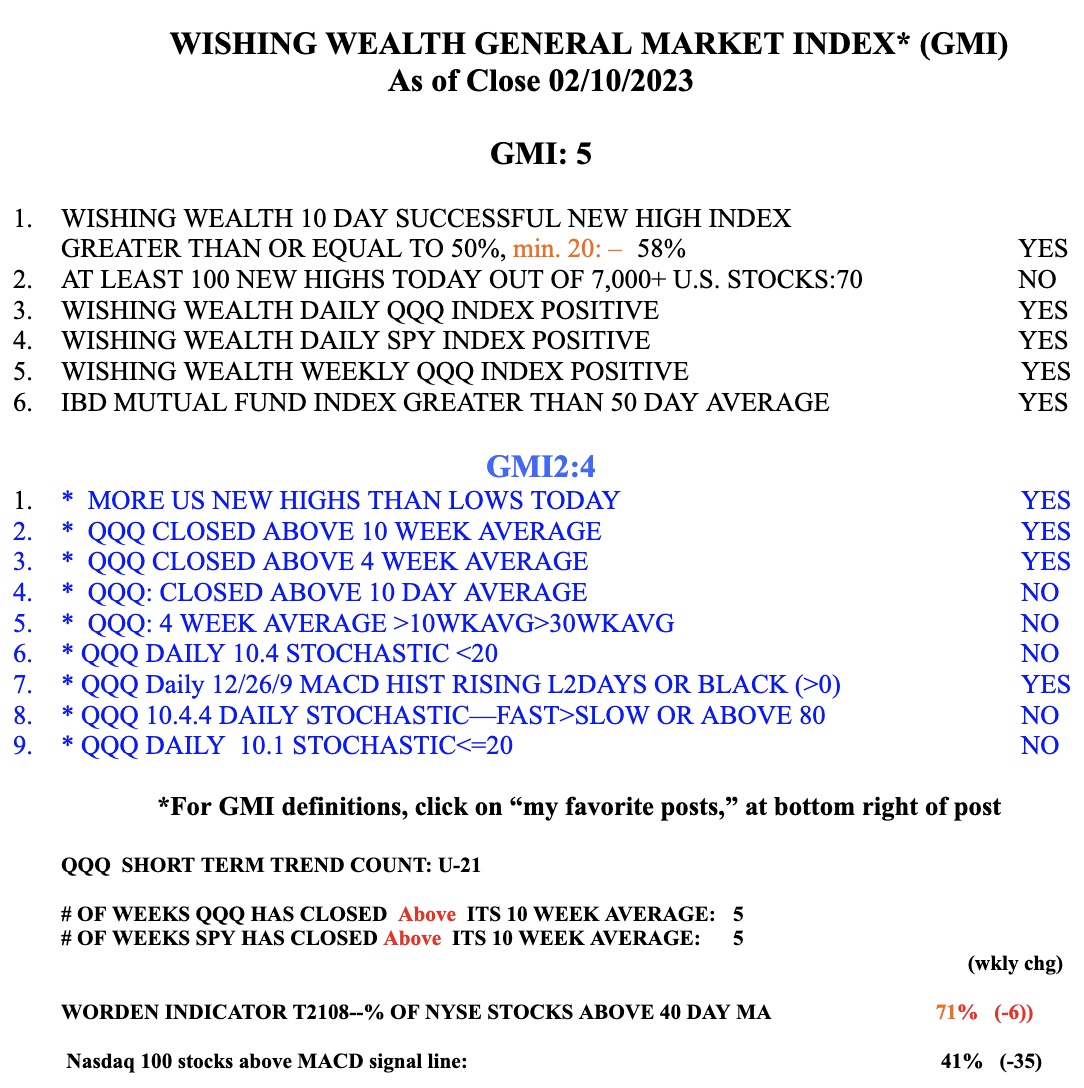
The GMI signal remains Green at 6 (of 6). It flashed Green at the close on January 13. I post my QQQ short term trend count in the table below and on each almost daily blog post.