I know my readers realize that I have been learning to trade and invest since the 1960s. Having survived many of the vicious declines ( I missed the one in 1962, but I remember the significant declines in 1987, 2000, 2007, 2020 and 2022). I have learned a few things. First, get out when the market peaks and ignore the media pundits and those telling me to stay the course. Second, after a prolonged decline, people first buy the big caps and big names until they feel more confident. Once they have profitable trades they take chances on the the riskier growth stocks. This may explain why the Dow has outperformed other stocks recently.
Too often we drive with our hands on the rear review mirror instead of looking forward holding the steering wheel. We focus on the prior decline and are skeptical of any signs of strength. The market does climb a wall of worry and with so many people fearing inflation and a recession, this may be the time the market bottoms and moves up. I am seeing news headlines this weekend saying one should just buy dividend stocks! That makes me feel more confident that we may have bottomed. So with the major indexes retaking their critical moving averages, I am slowly buying stocks and index ETFs. This is a good time to do so with stocks being so close to these critical averages. That is because if they should fall back below them I can exit with minimal losses…..
I am always seeking new ways to find promising stocks and I have developed a new scan that I shared with my students on Friday. Next Friday is the last class of this semester! I know many traders are aware that some stocks begin major advances with a large gap up on unusually high trading volume. Sometimes the gap day occurs after earnings have been released or after another positive announcement. Not having my eyes glued to the market most days, I cannot jump on such stocks on the day of the gap. However, I can buy them after they consolidate and begin another rise days or weeks after the gap day.
I therefore have developed a very simple scan using TC2000 that alerts me to such promising stocks. The scan looks for stocks that had a gap up day with the highest trading volume during the 20 days preceding the gap. I also want the high of the gap day to reach the highest price in the past 10 days. I could easily use this logic to find stocks having a high volume gap up on the current day. The trick is to tell TC2000 to look for any stock that had such a gap day within the past 25 days. (You can set this number to any time period to look back.) Once I have such a list of stocks I can review them to find any consolidating post gap and appearing ready to resume their up-trends. The huge volume gap up tells me that some big institutions probably saw a bargain and something worth owning.
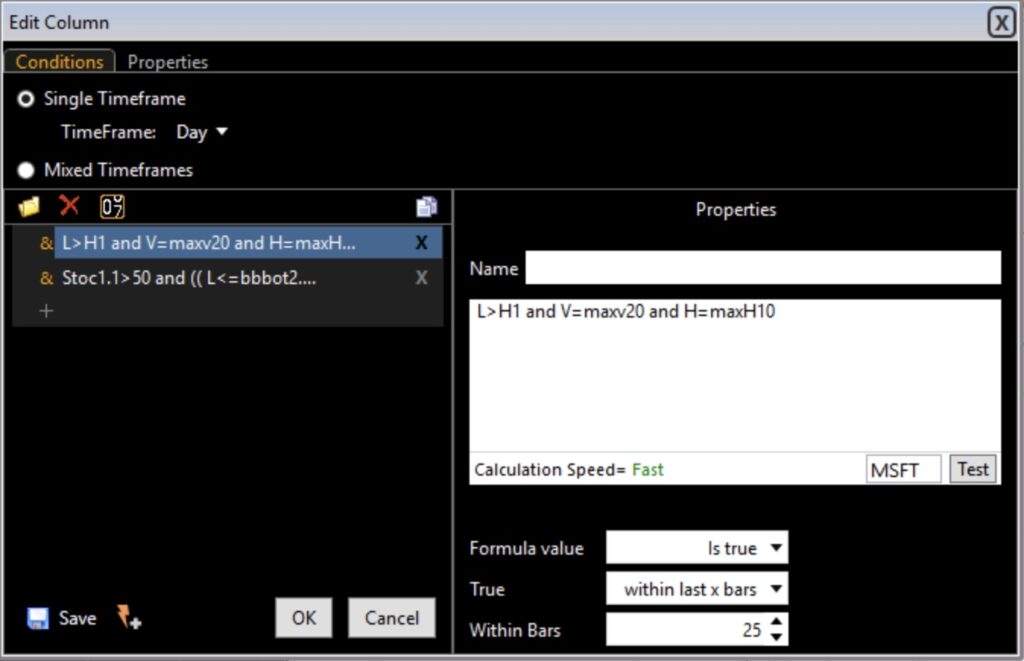
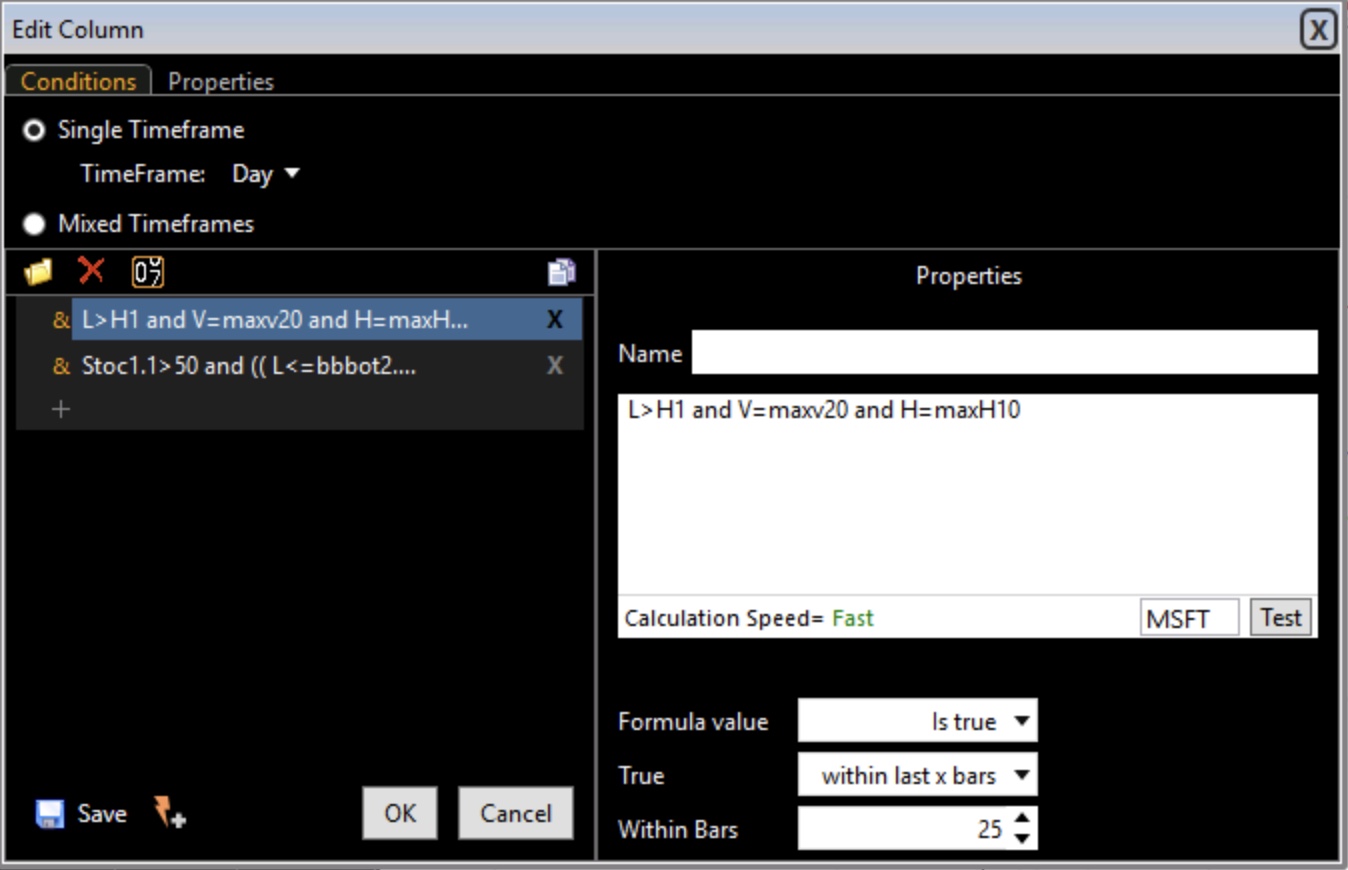
The above logic is so easy to build in TC2000. That is why I like this software. Just right click on any column to create a new column in your watchlist and use the following instructions:
- Set condition timeframe to daily and type this formula: L>H1 and V=maxv20 and H=MaxH10. (Low today greater than yesterday’s high on the highest volume in the past 20 days and the day’s high is the highest high reached within the past 10 days.)
-
The trick is to change this condition from being true now to true within the last 25 bars, here days.
-
In the properties tab, give the column a name and tell it to update automatically and tell it to show a check when the condition is true.
-
Save it with a name and save the column.
There you have it. Now open any watchlist you want and sort by this column. Here is a picture of the TC2000 set-up.
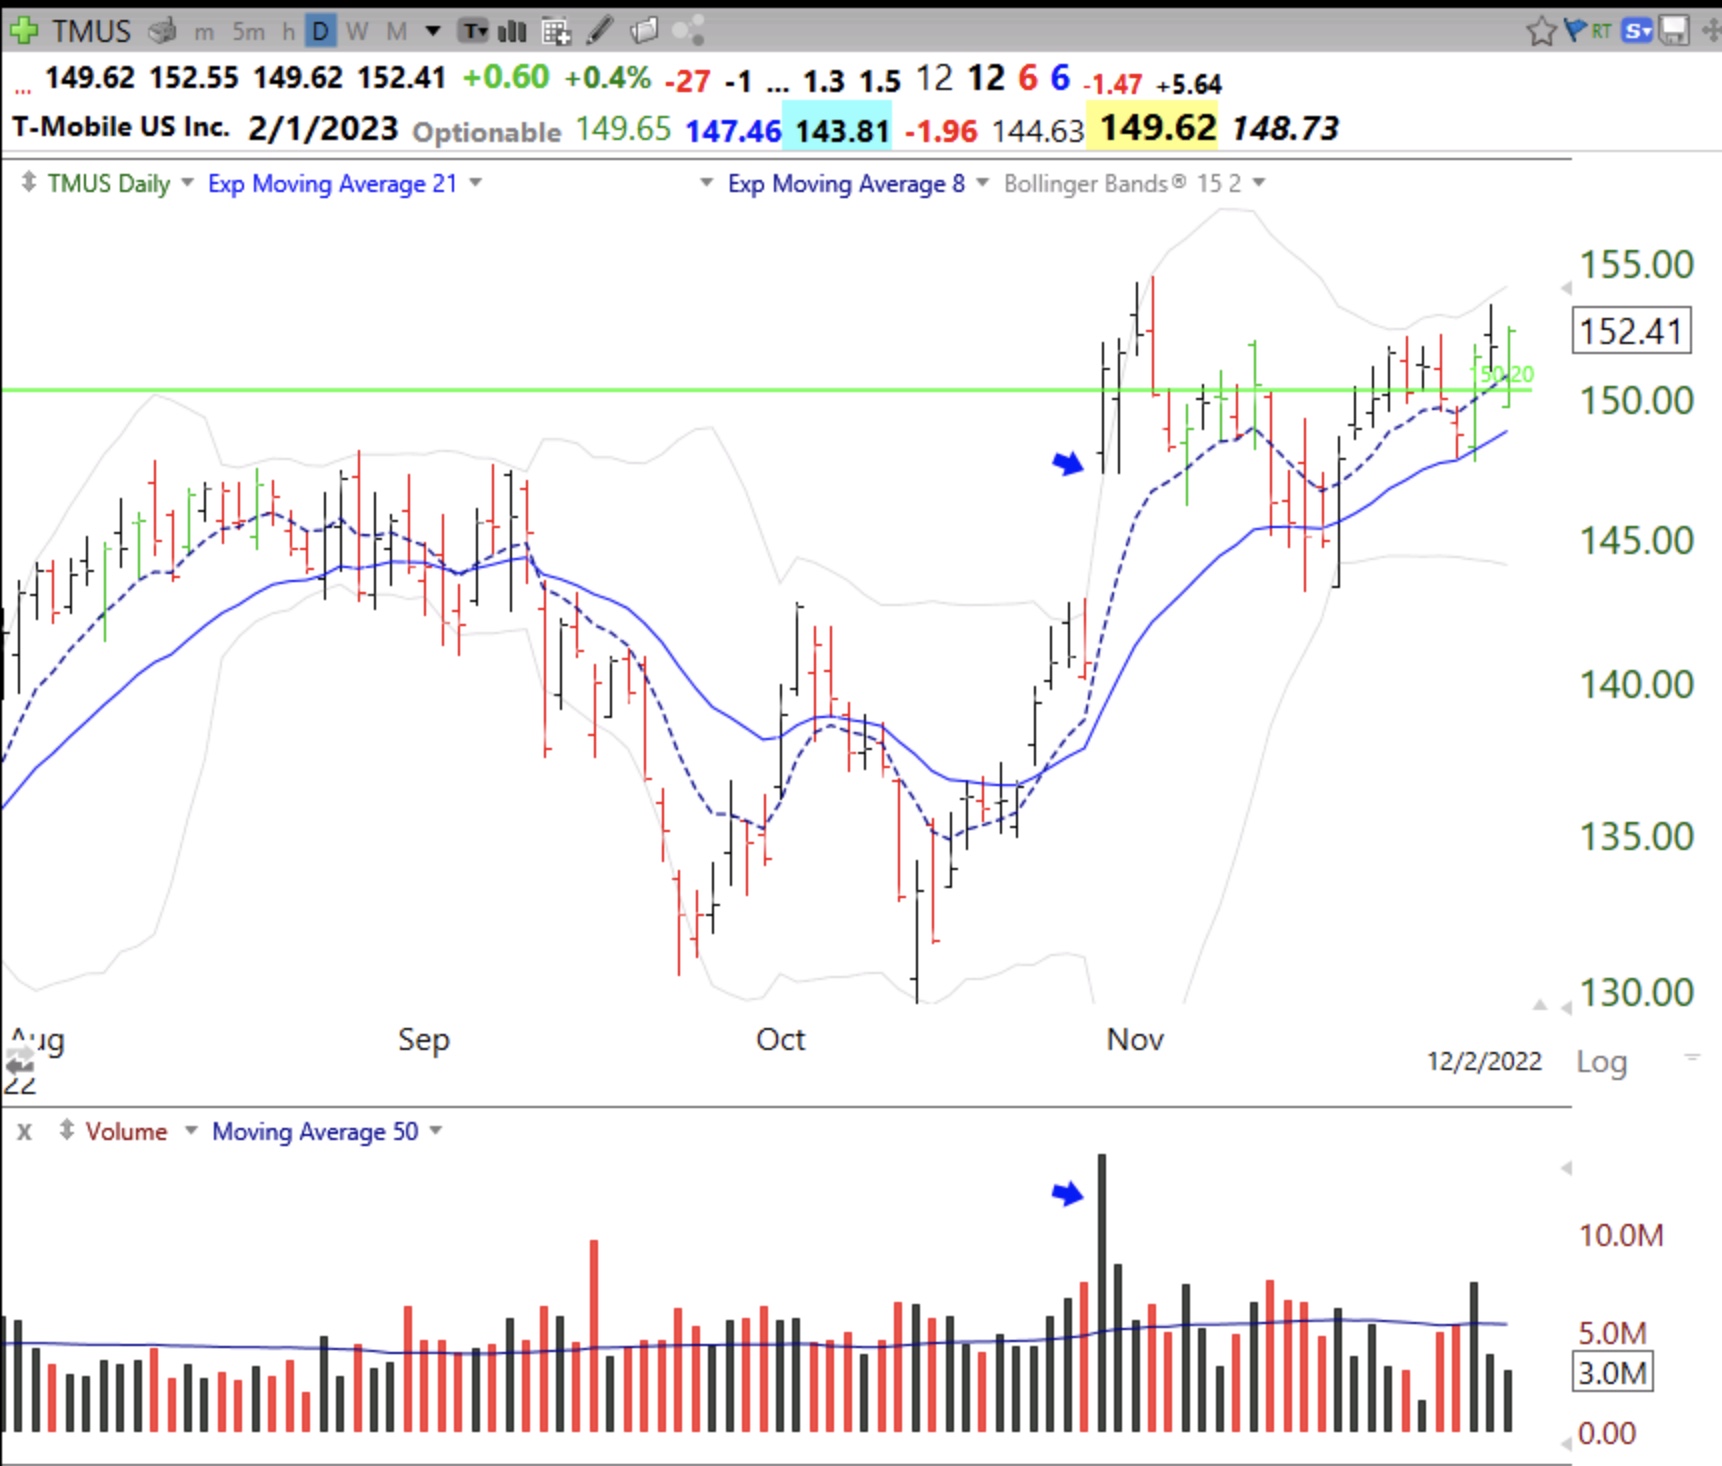
You can see that I also apply additional filters (not shown) to require a bounce up off of support or other set-ups. You can find the day that triggered the scan by looking for a day with volume that was larger than the 20 preceding days. You can then look for the gap. Here are two stocks that passed this scan, TMDX and TMUS. I put in arrows to show the extreme volume and the gap on the day that met the conditions. I LOVE this scan……
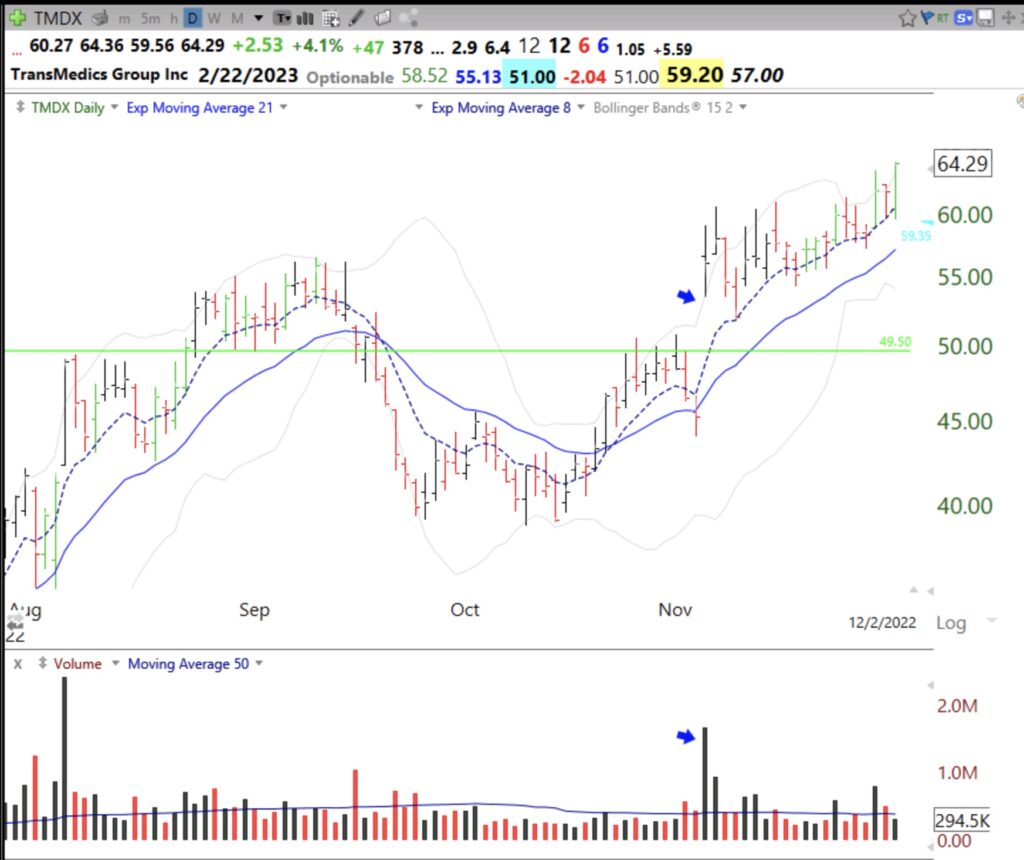
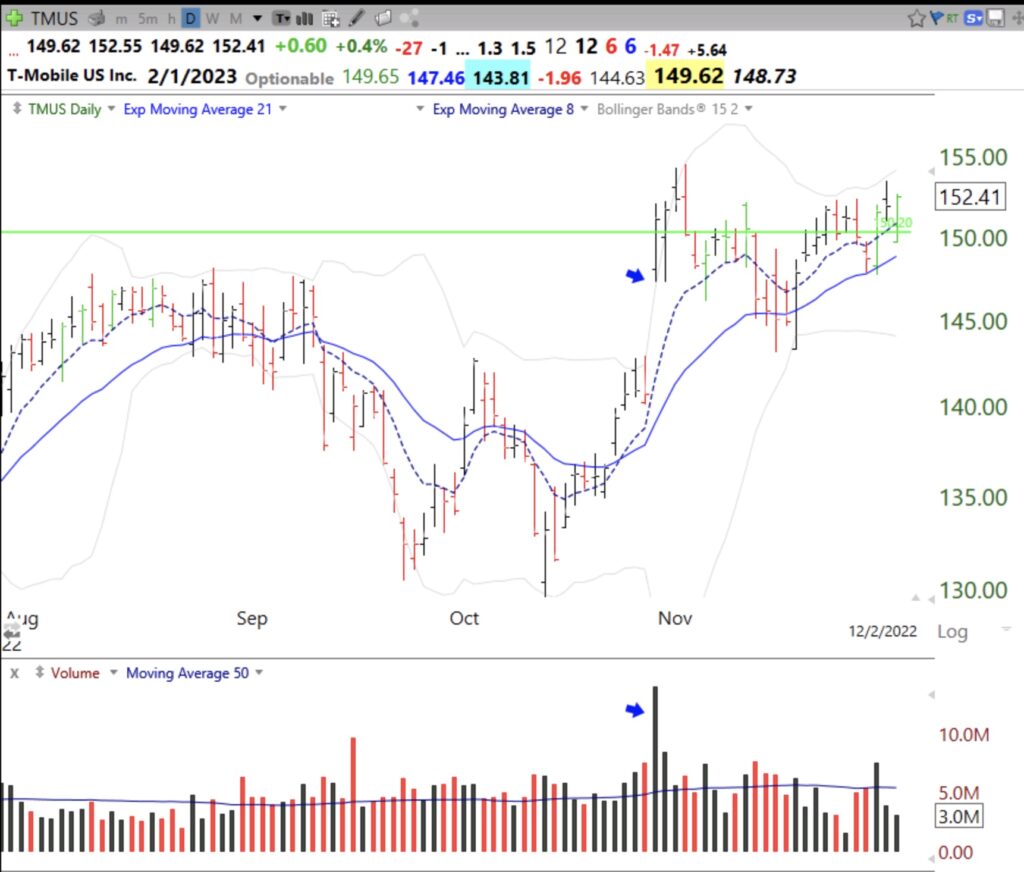
TMDX had a recent GLB and TMUS is in the midst of one. Both bounced Friday off of their daily 8 exp moving averages (dotted line). I hope you like this scan and can try them out. I use it to find promising stocks to review that institutions are likely buying. Remember, however, that a huge gap up can signal the end of a large move rather than the beginning. One must evaluate each stock’s chart and trend carefully….
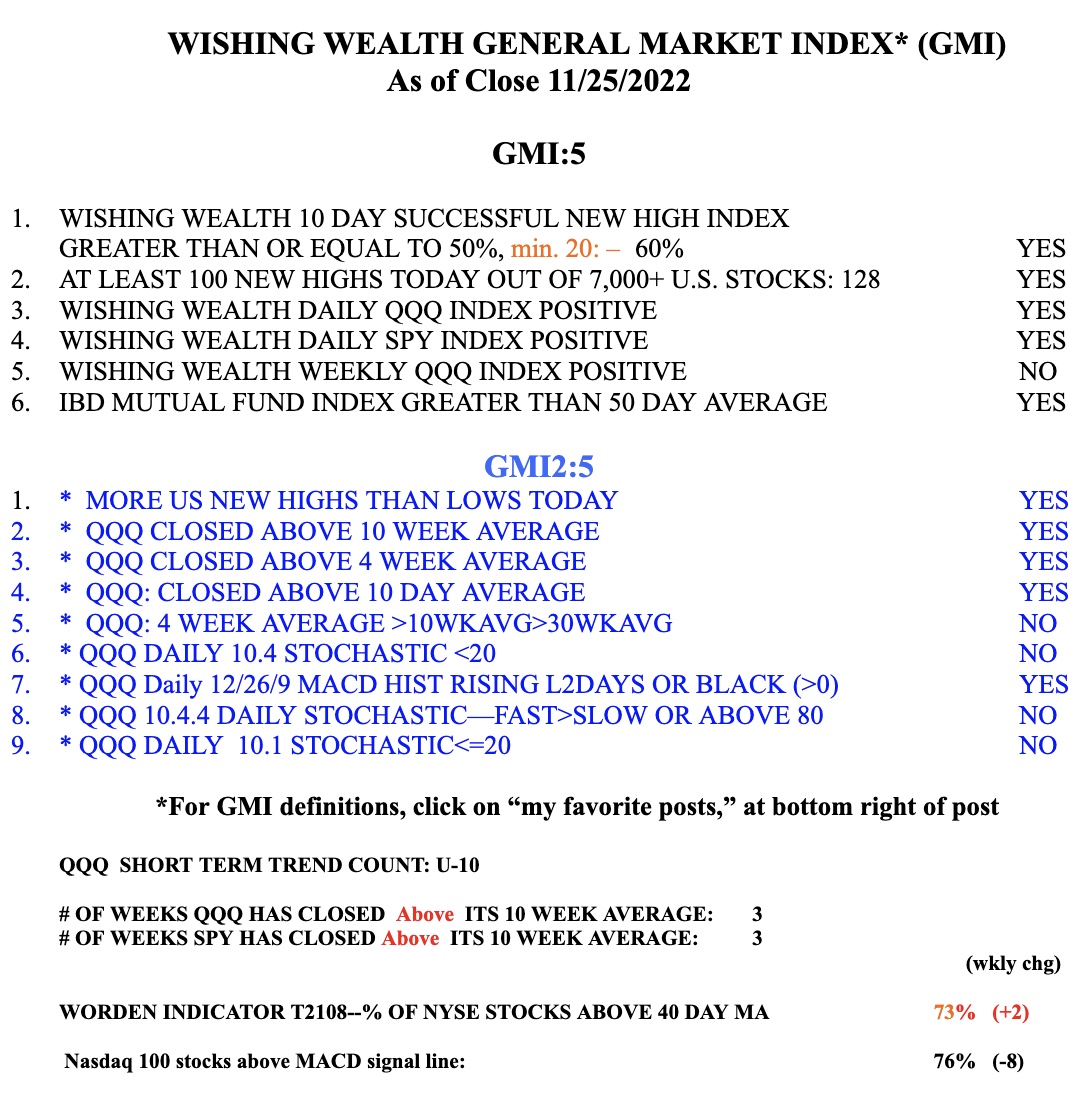
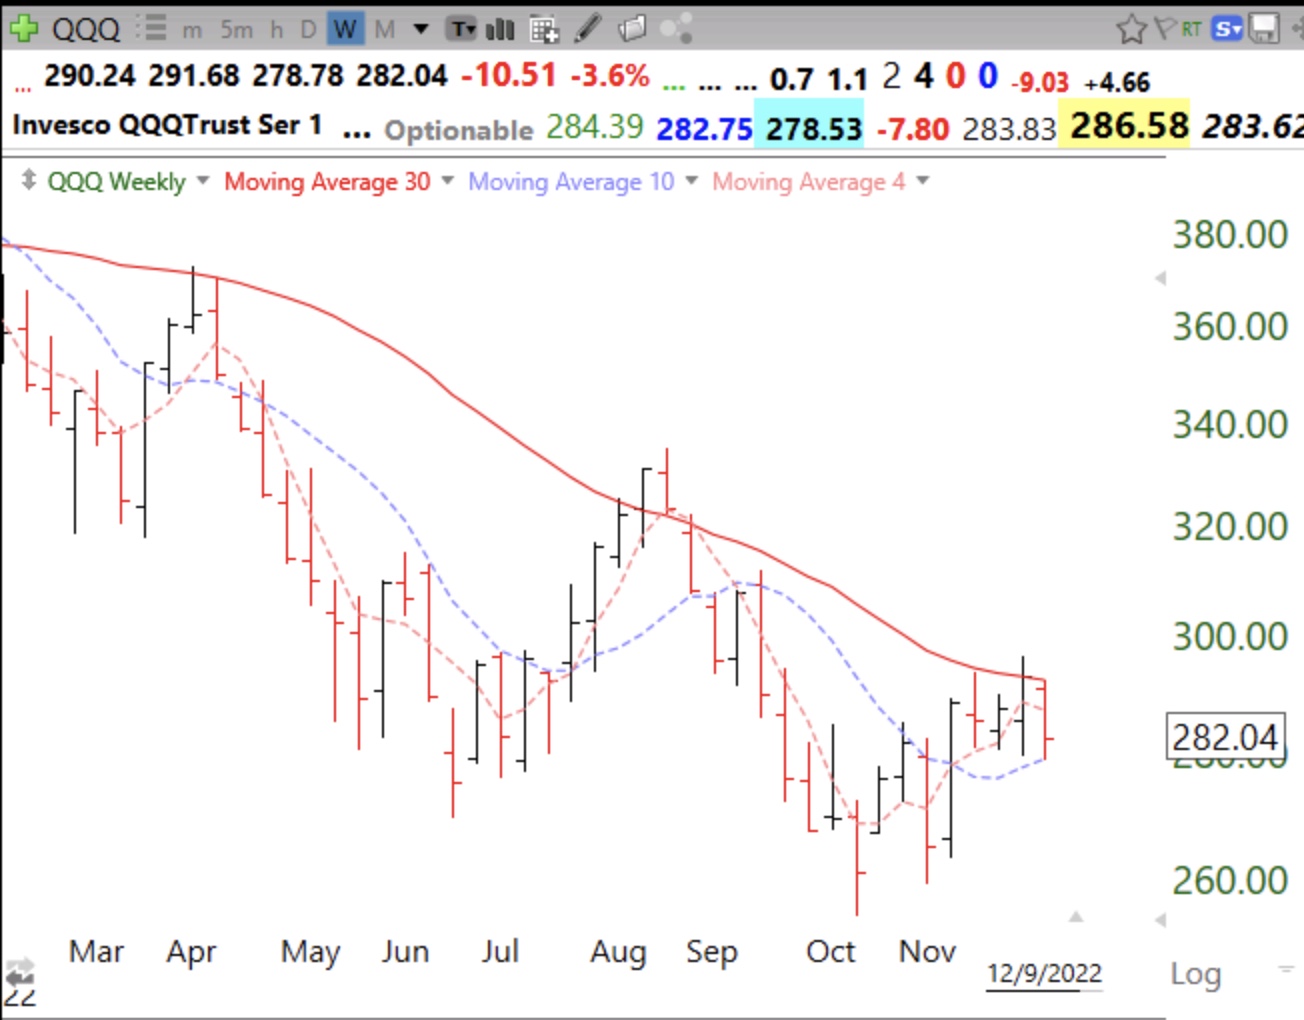
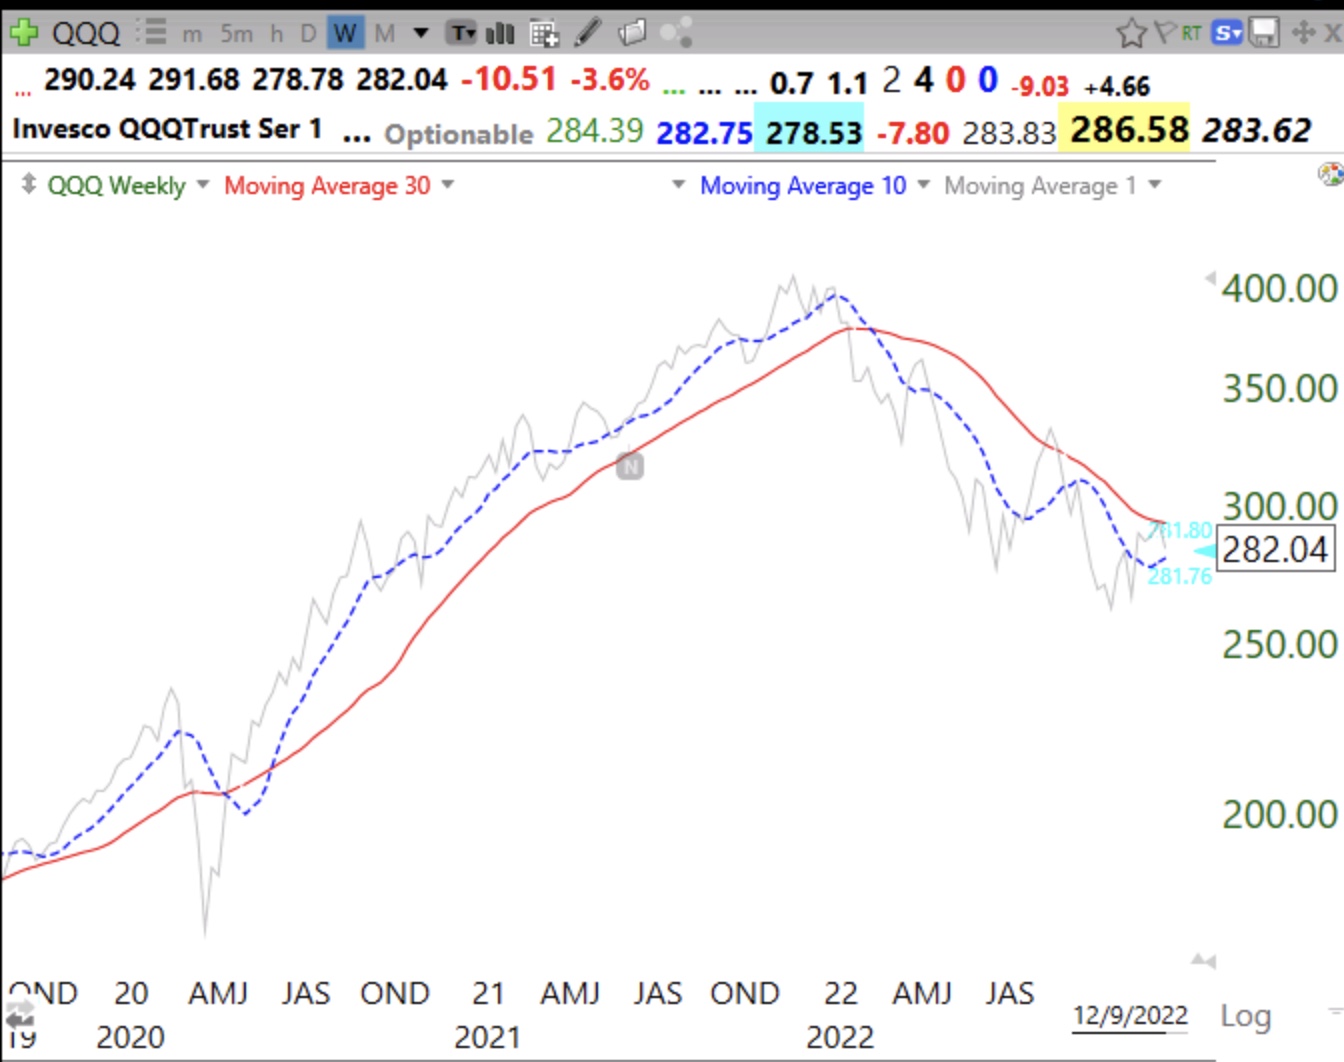
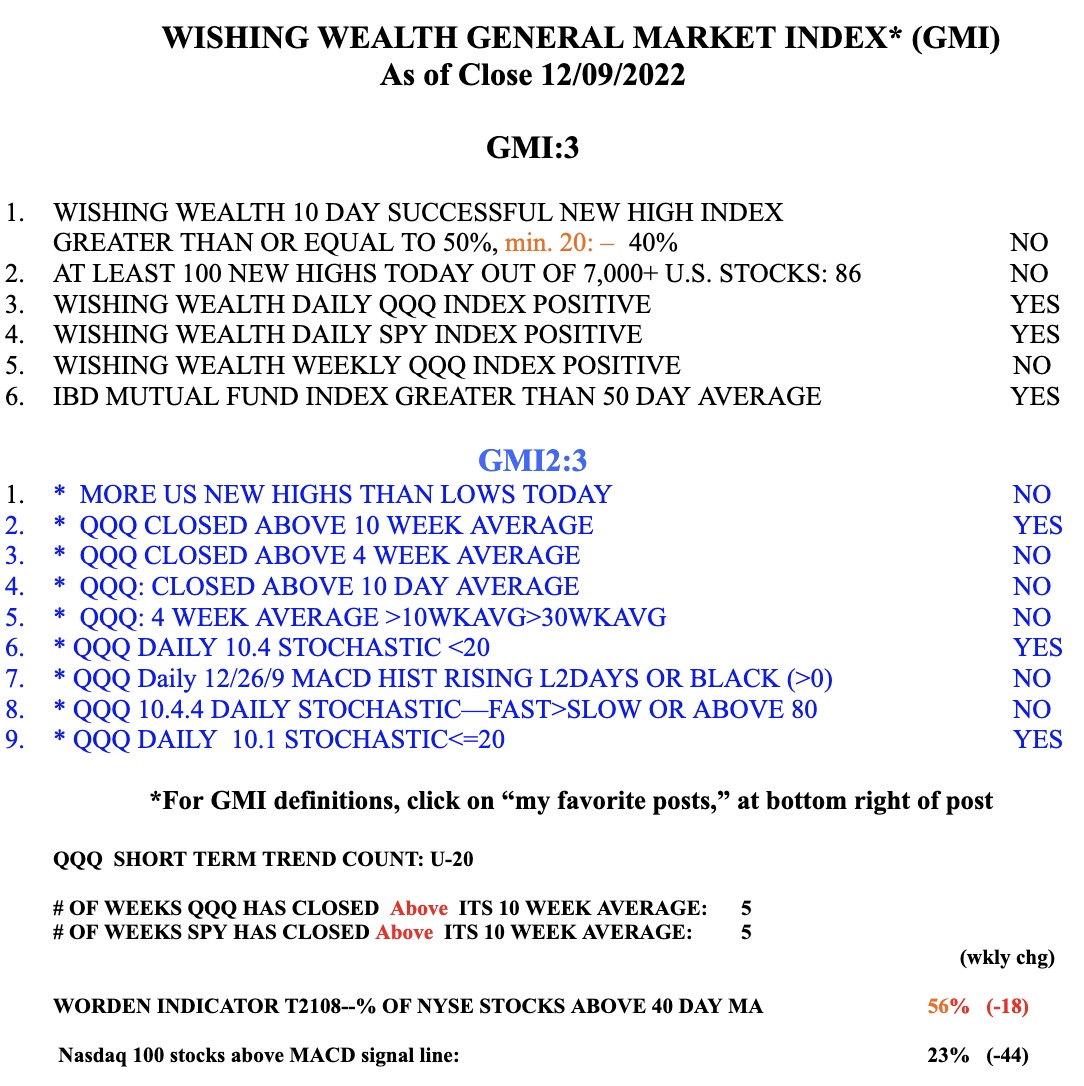
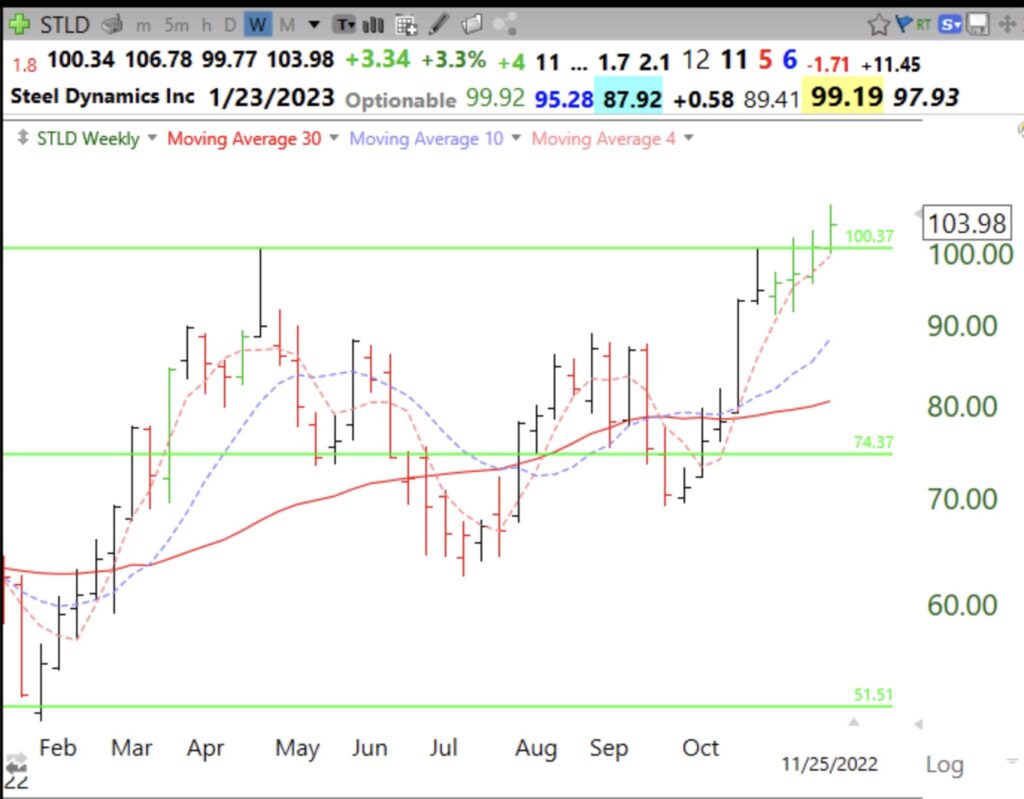
The GMI remains at 6 (of 6) and key Index ETFs have closed above their 10 and 30 week averages. 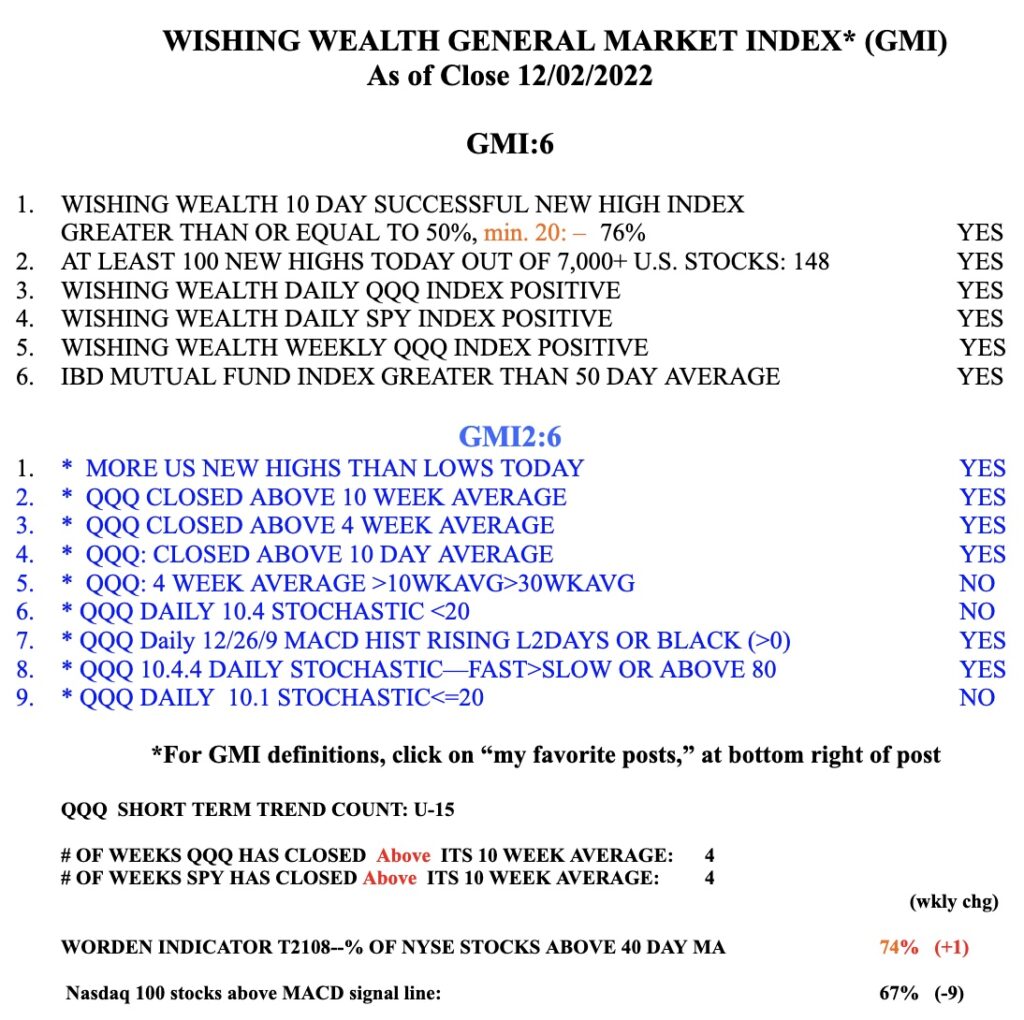


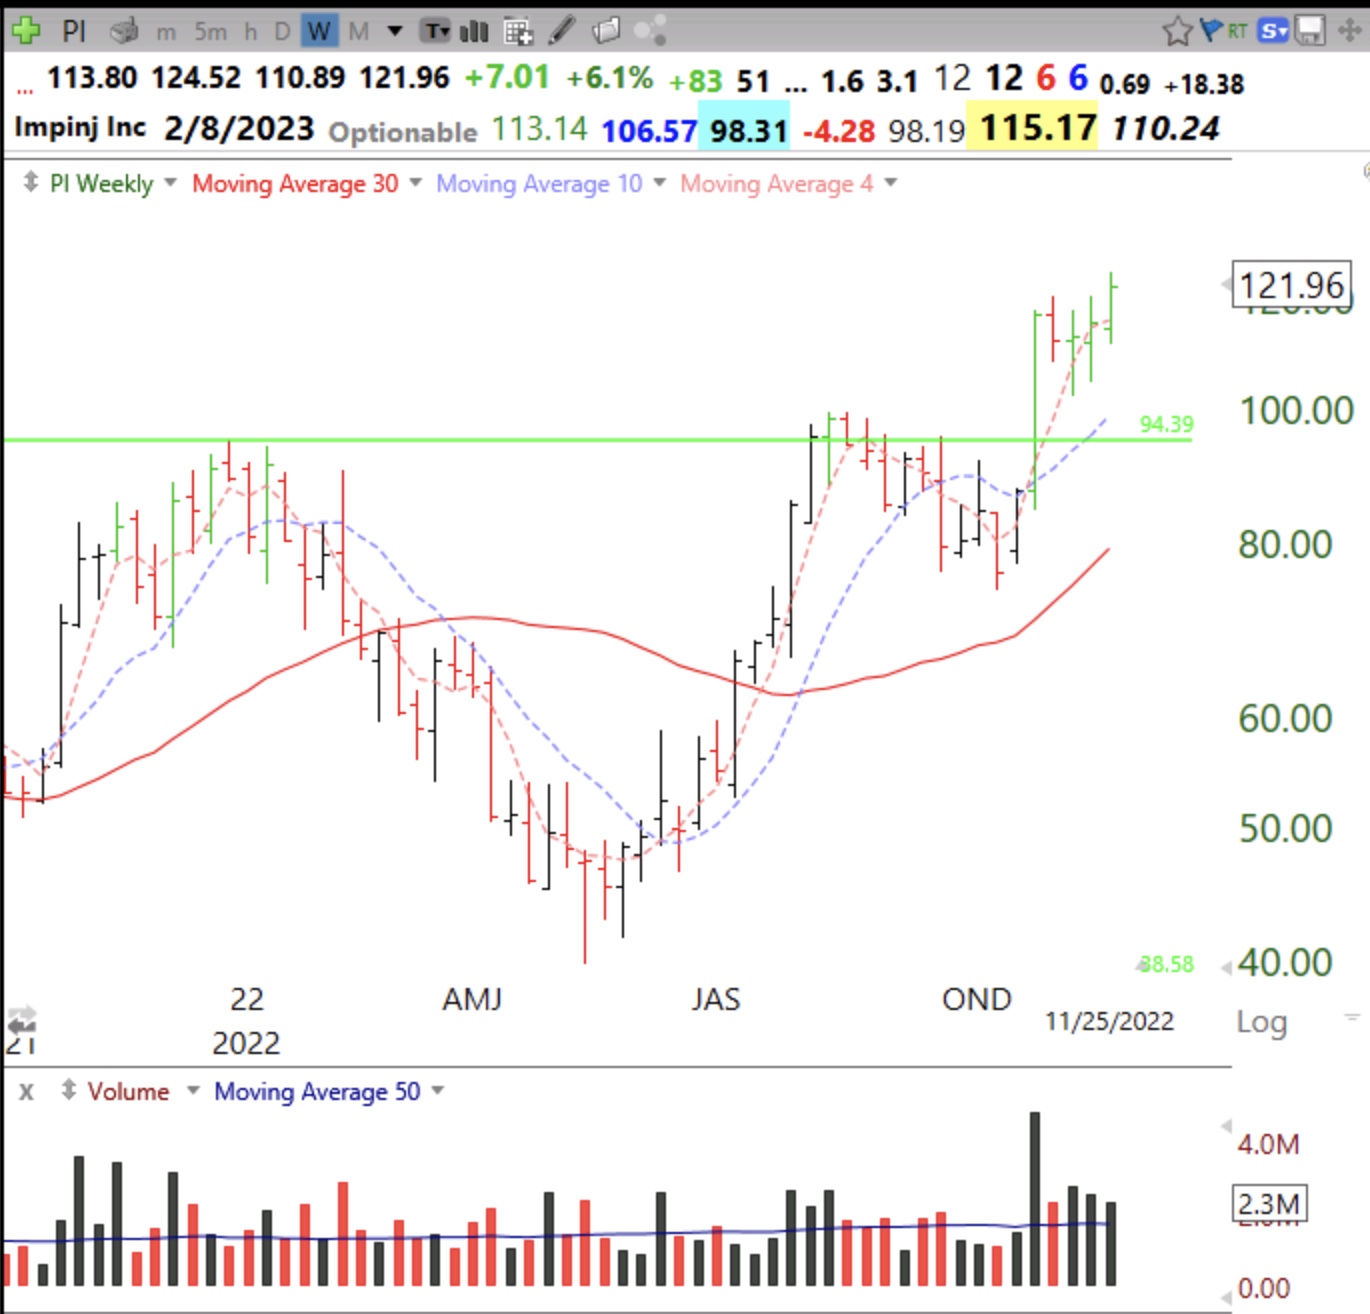
 PI also had a weekly green bar last week after its recent GLB. Note the huge volume on its GLB week. Cup and handle too?