Blog Post: Day 6 of $QQQ short term up-trend within a longer term down-trend; Critical week coming up for $QQQ, which is between the rising 4 wk avg and the declining 30 wk avg, see weekly chart

GMI5/6
GMI-24/9
T210871%

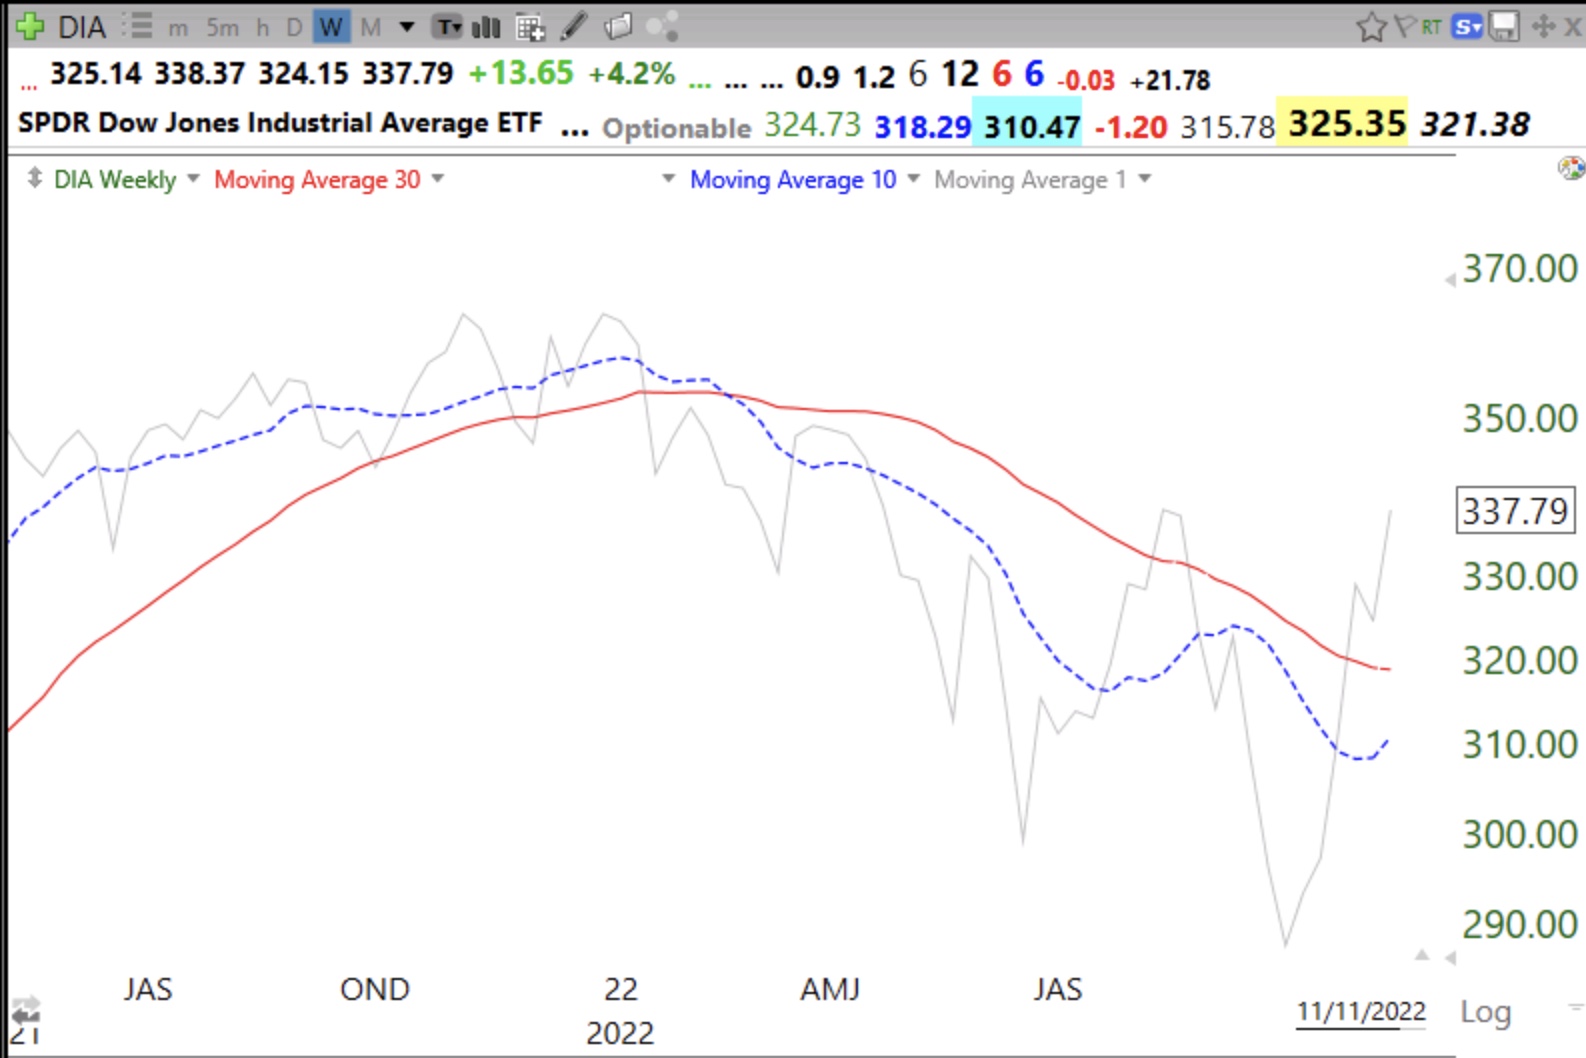
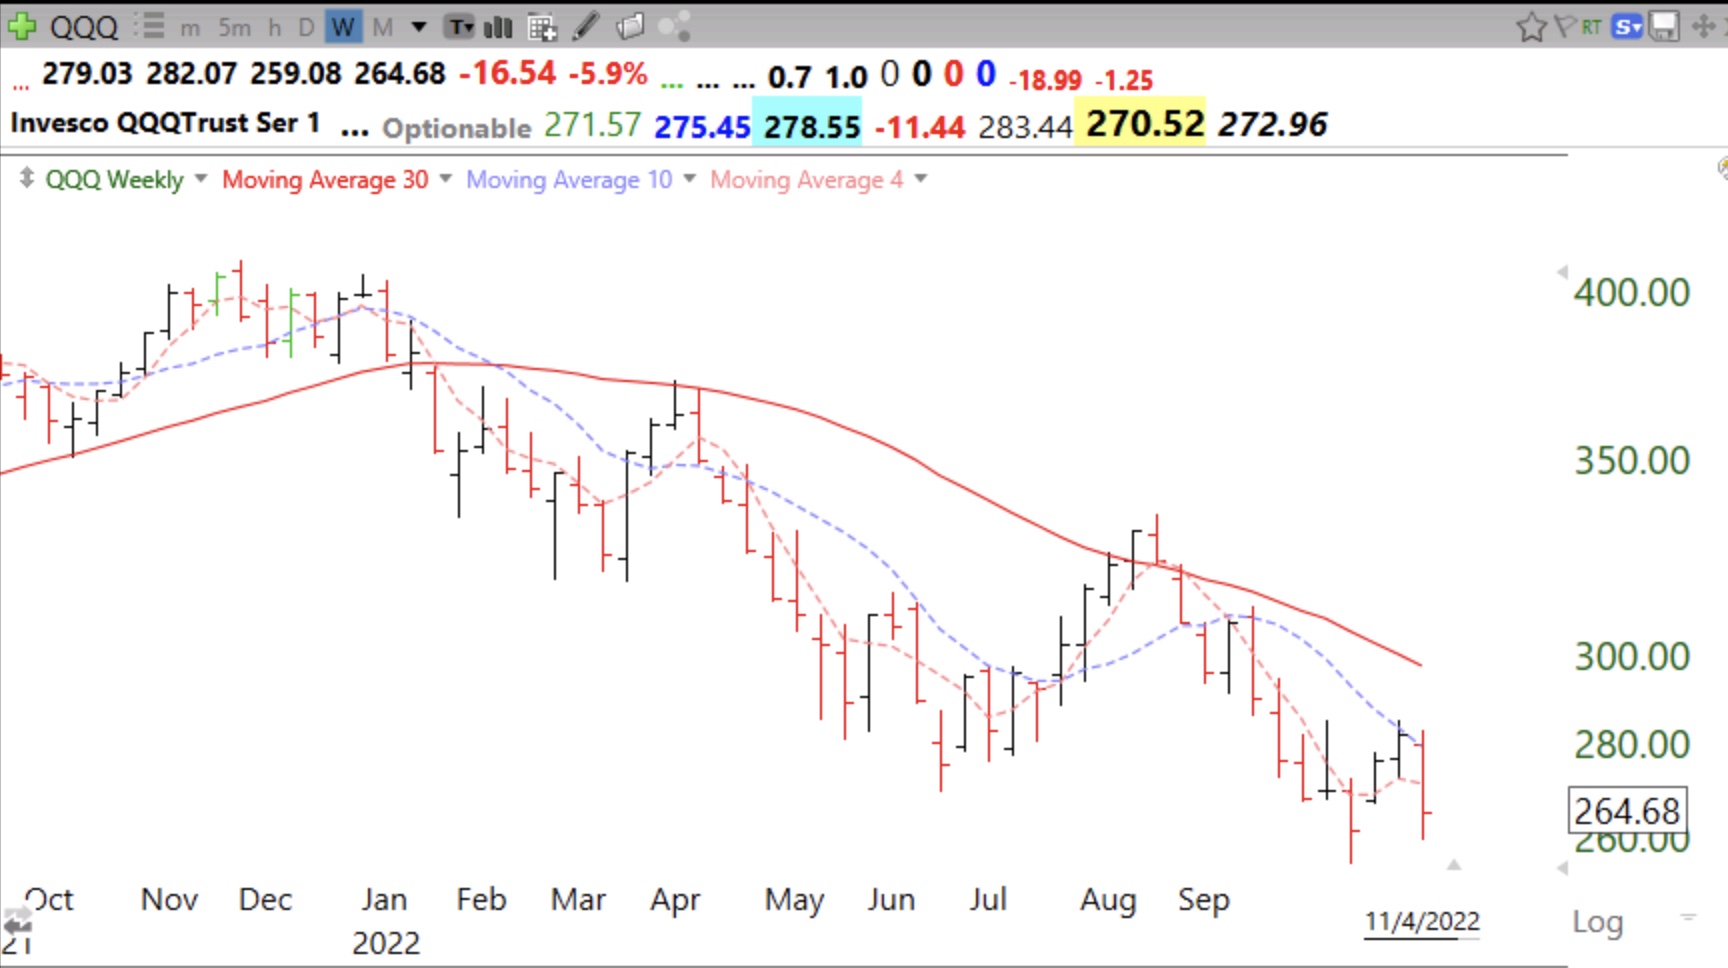
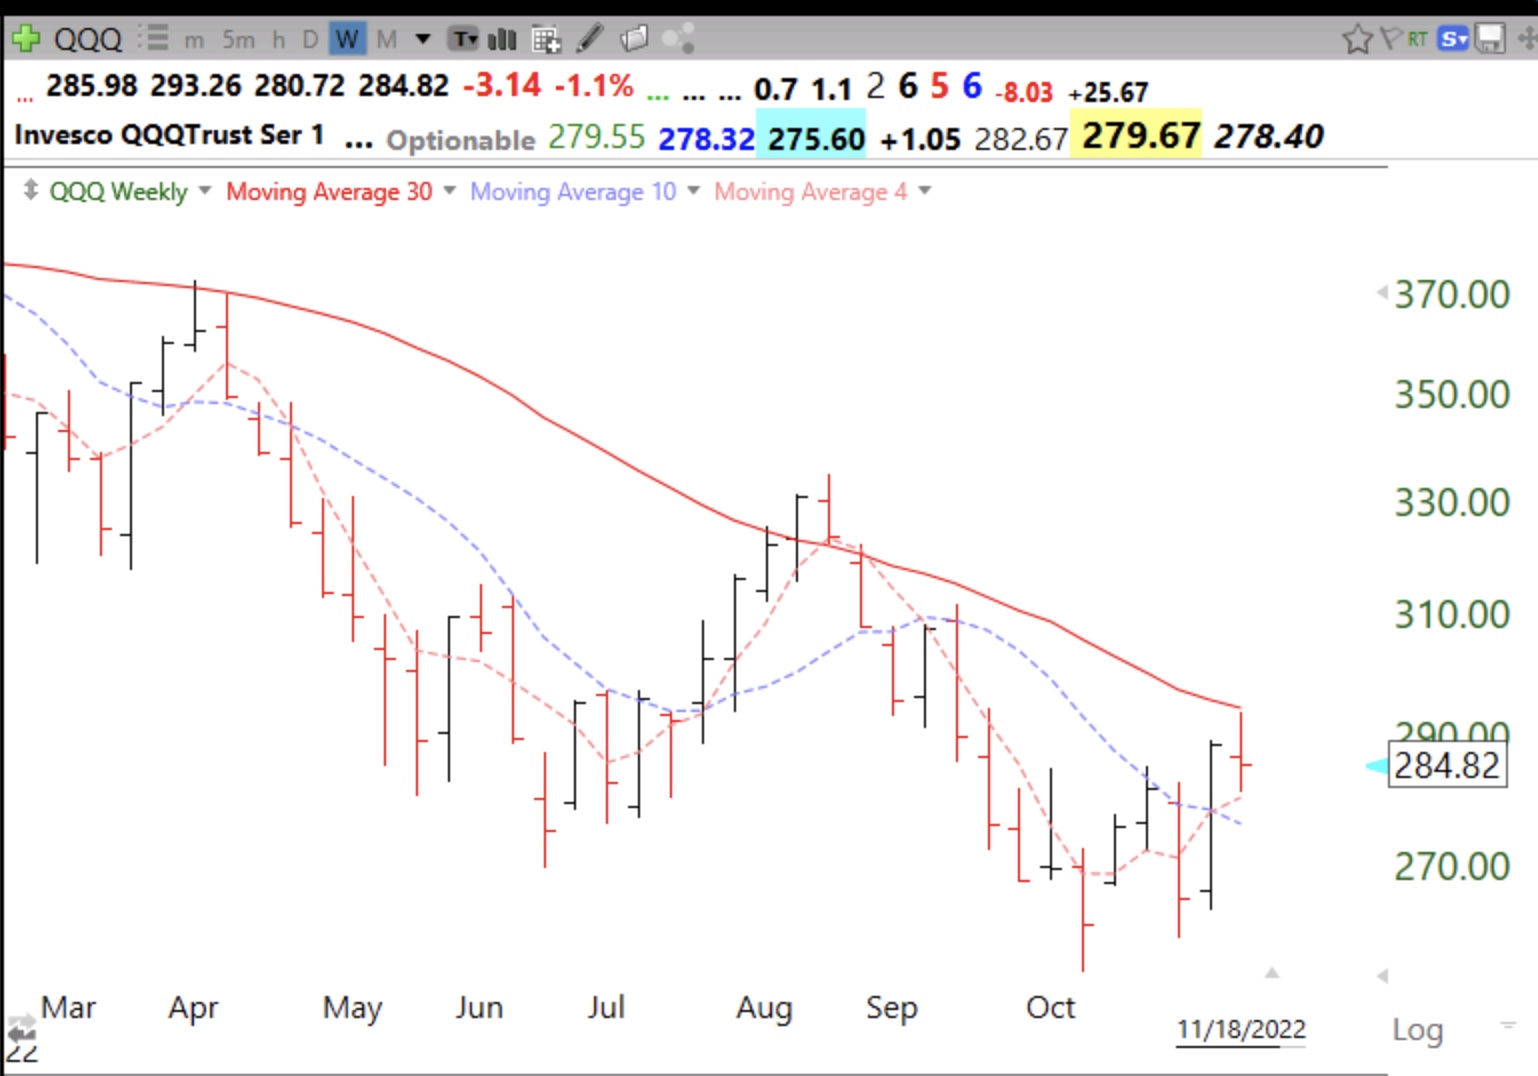
The 4 wk avg is the pink dotted line and the 30 wk avg is the red solid line. Note that last week QQQ was sandwiched in between these two averages. The rising 4 wk avg above the 10 wk avg (purple dotted line) is a positive sign. A close this week above the 30 week could be a further sign of strength, although such a pattern failed to hold last August. On the other hand, a close below the 4 wk would suggest further weakness to come. Stay tuned…..

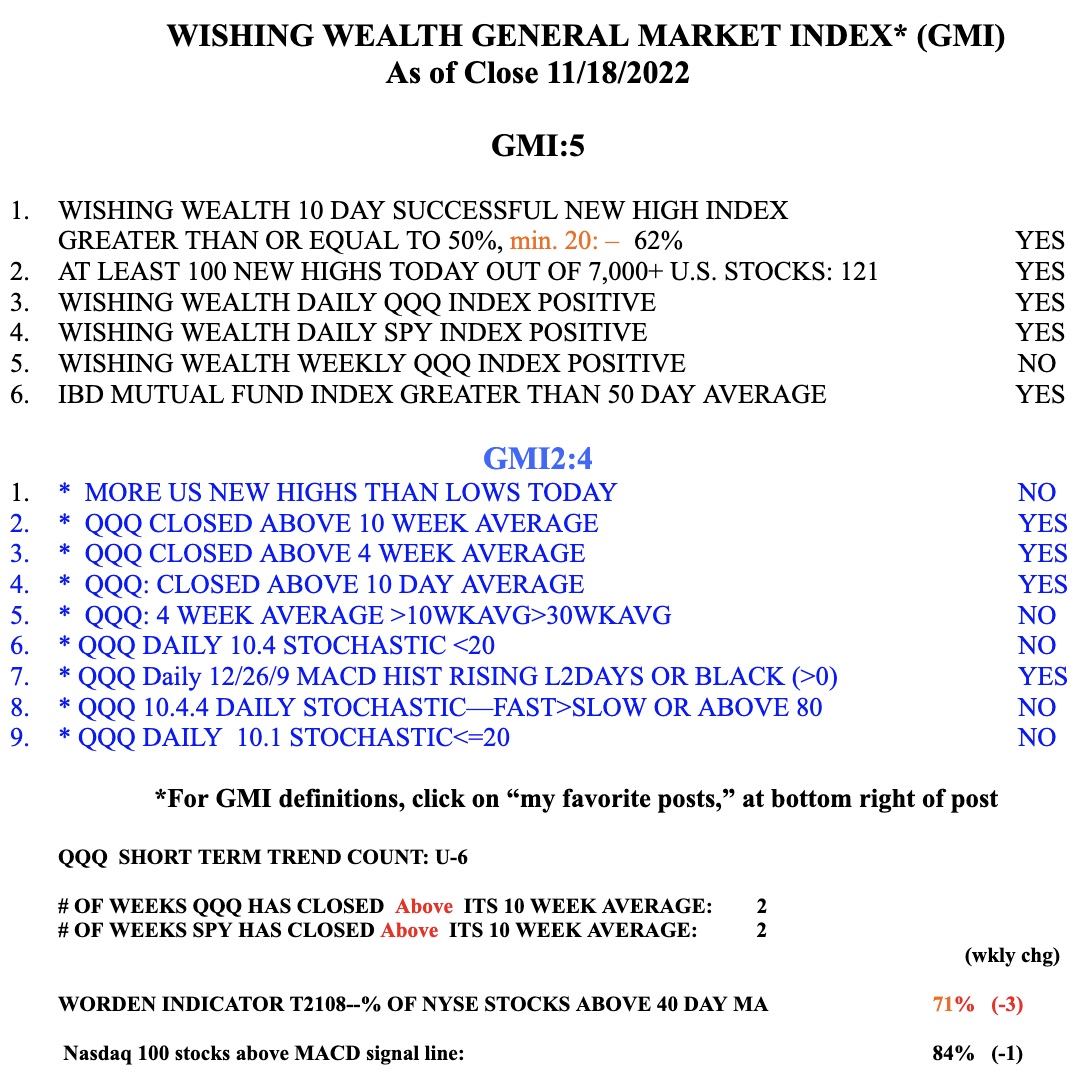
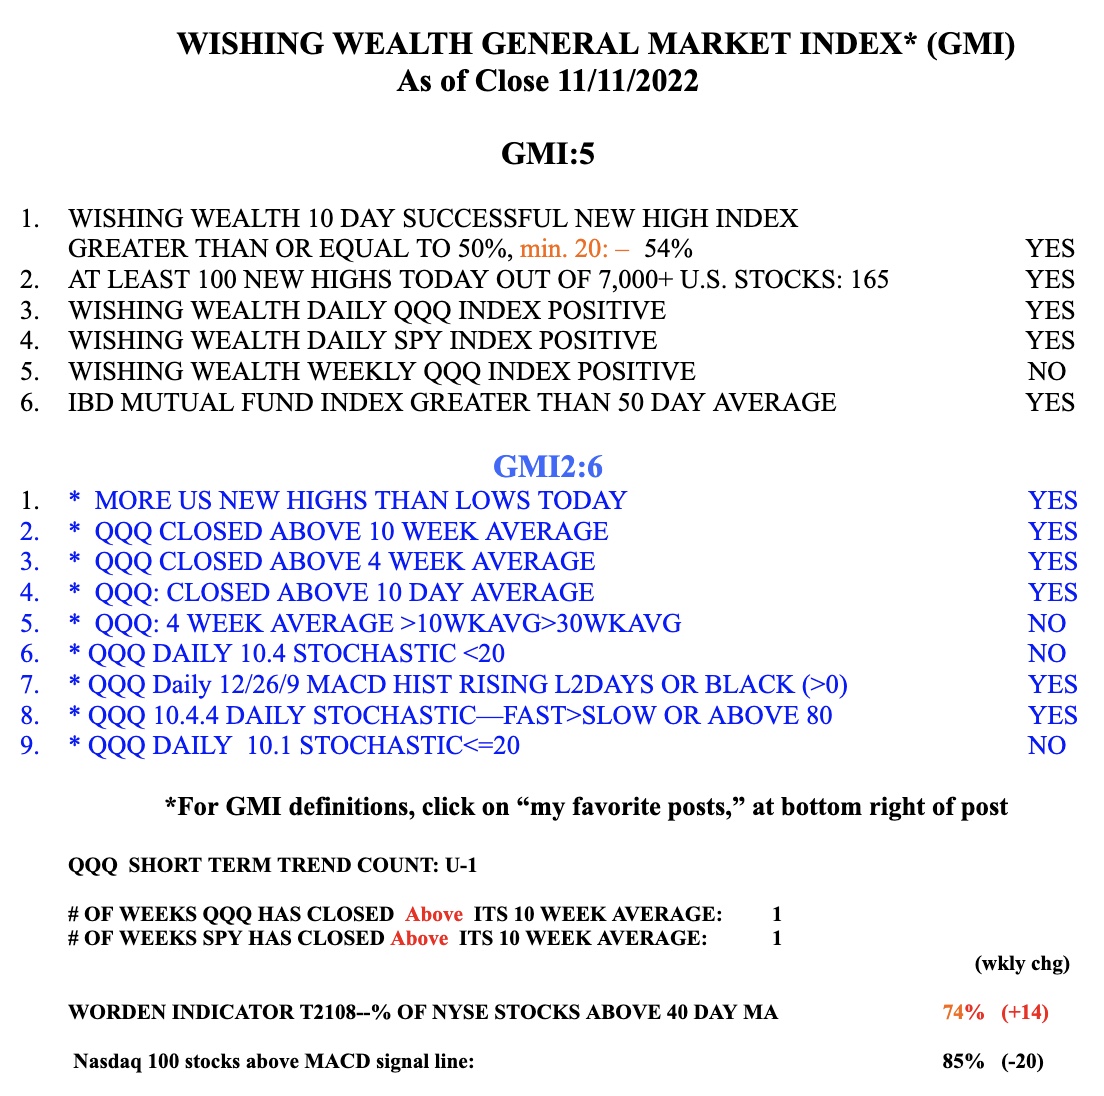
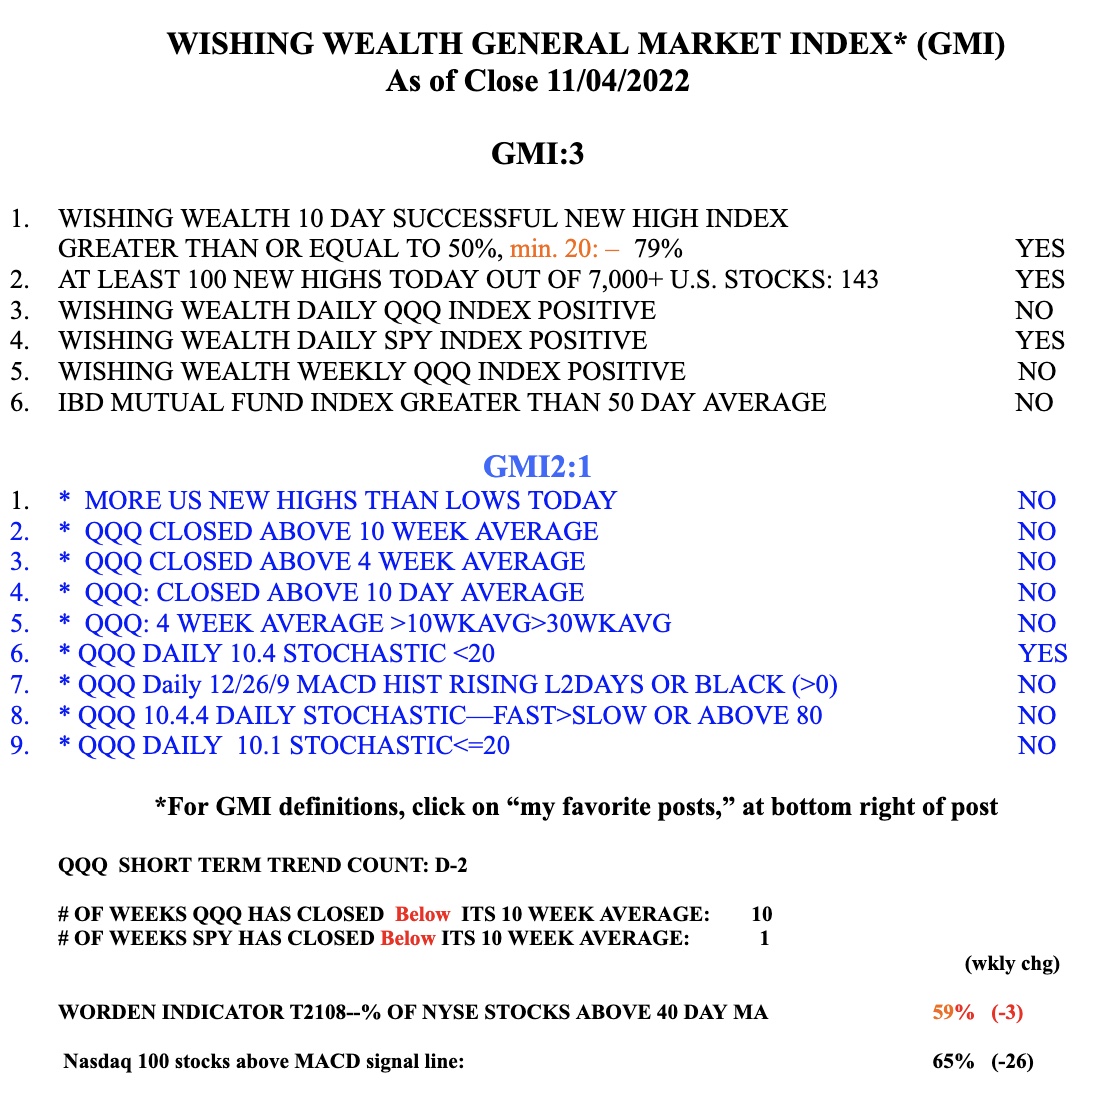
The GMI registers 5, of 6, and remains on a Green signal.

Blog Post: New $QQQ short term up-trend; GMI= 5 and remains on a Green signal since 10/26; Can 10wk average retake 30 wk? See weekly 10:30 charts of $QQQ and $DIA

GMI5/6
GMI-26/9
T210874%

I will be looking for a true change in the market’s trend when the 10 week average (blue dotted line) retakes the 30 week average (red solid line) and the 30 week average turns up. Until then, I am less confident of a true change in the longer term trend of QQQ or DIA. The gray solid line is the weekly close


DIA is stronger but not there yet.