I have told you that I have been writing weekly calls on my position in GLD. GLD is an ETF that owns gold. I have been learning how to bring in a nice income by writing calls on GLD because gold seems to be turning up in a Stage 2 up-trend. Gold often reflects investor fears about the world situation in general and/or about currency inflation. It will be a while before we learn what is behind the apparent up-trend in gold.
Here is how I make money from my position in GLD. GLD closed Friday at $127.58 per share. Weekly calls on GLD that expire next Friday, 2/28, with a strike price of 127.50 closed at 1.05 and with a bid/ask spread of 1.01/1.05: ![]() . For the purposes of this example, I can sell this call option, the right to buy 100 of my GLD shares from me at 127.50 per share for a price of about $1.01 per share. In other words for every call I sell, some call buyer will pay me about $101 (call=100 shares x 1.01 per sh). This a yield of 1.01/127.58= .79%, excluding commissions. But wait, if I can repeat this each Friday, or 4 times in a month, that equals an expected return of 4 x .79= 3.17% for the month! How would you like to make 3.17% each month on your investment?
. For the purposes of this example, I can sell this call option, the right to buy 100 of my GLD shares from me at 127.50 per share for a price of about $1.01 per share. In other words for every call I sell, some call buyer will pay me about $101 (call=100 shares x 1.01 per sh). This a yield of 1.01/127.58= .79%, excluding commissions. But wait, if I can repeat this each Friday, or 4 times in a month, that equals an expected return of 4 x .79= 3.17% for the month! How would you like to make 3.17% each month on your investment?
So, what are the risks? On the next Friday, I get to decide what to do based on GLD’s current price. IF GLD is below 127.50 (the strike price of the calls I sold) the person who bought my calls will not use the call to buy my shares from me because he can go into the open market and buy GLD for less than 127.50. Thus the calls I sold expire worthless and I just pocket the money I earned from selling them. As long as GLD does not fall a lot in the week, I do not care because I simply turn around and sell again a new call on my shares at a new strike price to earn more income. If GLD were to plummet in one week, however, the premium or”rent” I took in will not cover the decline in price of my shares. That is the main risk. On the other hand, I rely on my technical analysis skills to alert me to the possibility that GLD is turning down.
If , however, on next Friday, GLD is trading above 127.50, I can just buy back the calls I sold. I do not mind paying more than I sold them because on the last day of trading before their expiration, the price of my GLD goes up and converges with the price of the option. Thus if GLD is trading at $130, the call to buy the stock at 127.50 will be trading close to $2.50 (130-127.5). I still get to pocket the time premium from selling my original options and can repeat the entire process over again for the next week. If GLD closes the week at $130, I turn around and sell new calls with a strike price of $130 or $130.50. I know some of this is difficult to understand. If you want to learn more about the process of selling covered calls, read Alan Ellman’s books listed to the right if this post. You may also come to our joint AAII DC Metro workshop next July. Click here for Alan’s website.
If you can’t wait, I will attempt to explain this example mathematically. I buy GLD at a current cost of $127.58. I sell the 127.50 weekly call option for 1.01 per share. Time value of call= 1.01 – (the true value of the option if it were exercised today, 127.58-127.50=.08) = (1.01-.08)= .93. Thus the most I can gain from this trade is the .93 per share time value. If, for example, GLD were selling at $130 next Friday near expiration, the options I sold will be worth (130-127.5)= 2.50 per share. So maybe I could buy them back around $2.52 per share. Thus, I bought GLD shares at 127.58 and sold the call at 1.01 and bought each back at 2.52: Net cost of my GLD shares= 127.58-1.01 + 2.52 = 129.09 per share. My stock cost me a net of 129.09 but GLD is now selling at 130.00, so I have a profit of .91 per share, excluding commissions (the original time value of .93 – the extra .02 time value it cost me to buy back my calls). This trade would yield me $91 for each call sold or a weekly per share yield of .91/127.58= .71% or about 2.9% per month, excluding trading costs.
I do not sell covered calls on growth stocks because if the stock takes off, my gain is capped by the strike price of the calls I sold. If the strike price is 150 and the stock goes to $200 I have to deliver my shares to the call buyer at $150 per share. This is a reasonable risk for me to take for GLD but not for rocket stocks that can gap up huge. Let me know if you found this example useful……
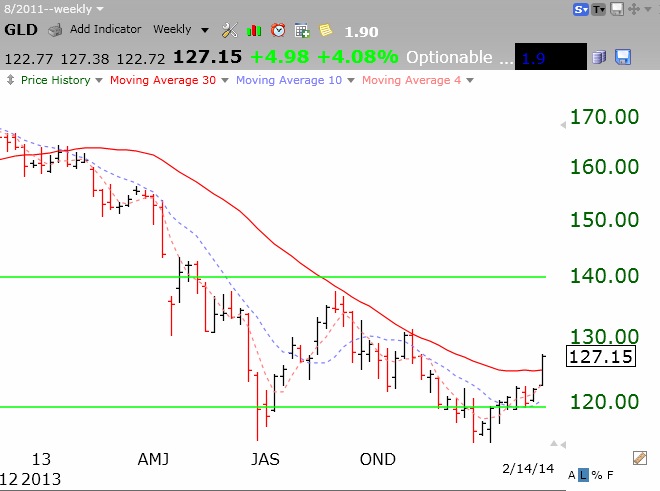
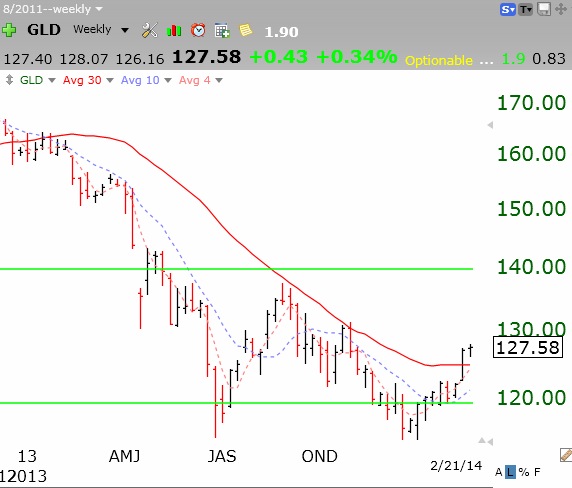
Here is a weekly chart of GLD. Looks like the beginning of a Stage 2 up-trend.
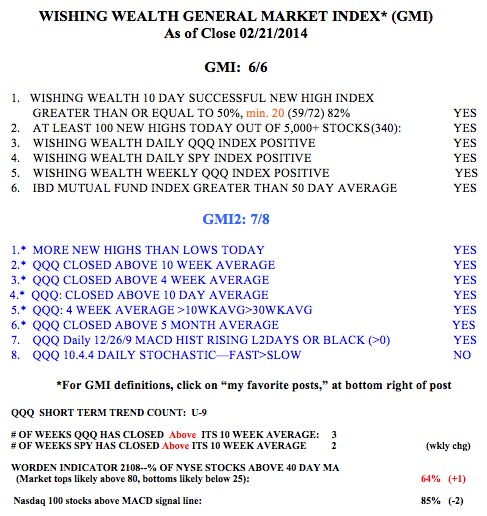
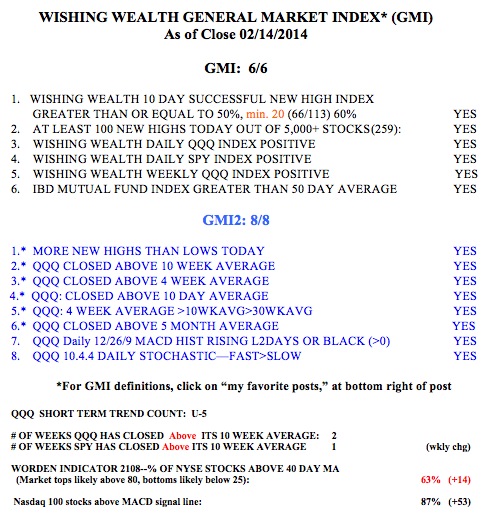
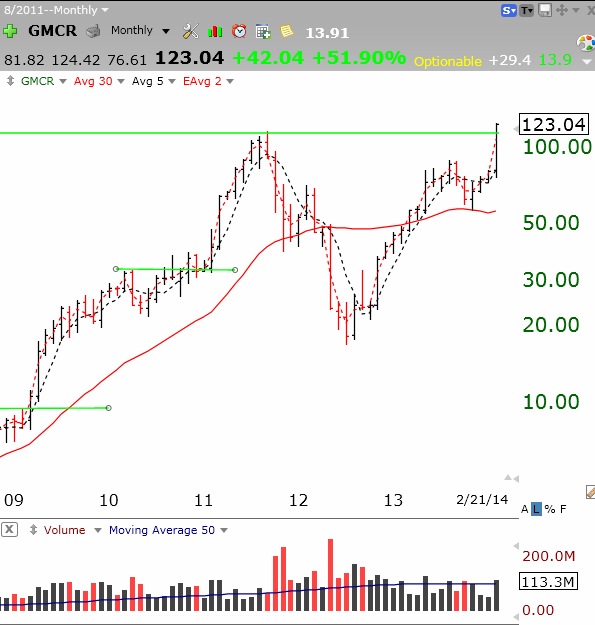
The GMI (see table below) remains at 6 (of 6). I am therefore looking at growth stocks. GMCR, a stock I first wrote about in 2009 when it broke to an all-time high, has just broken out of a new green line base to an all-time high. Check out its monthly chart.
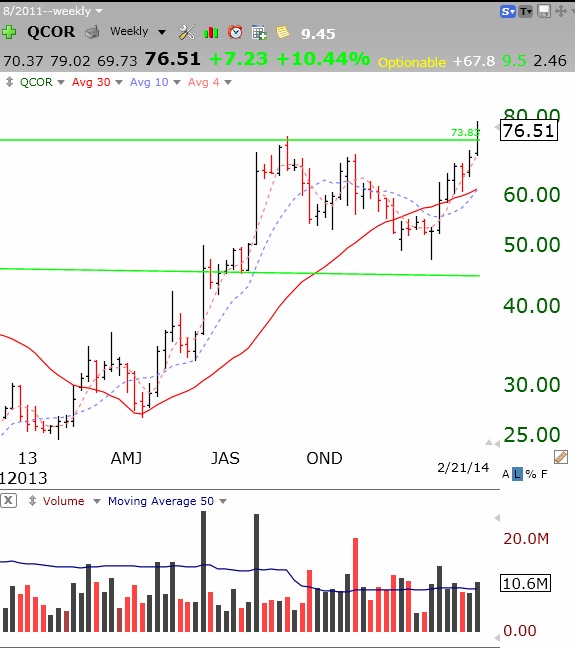
 As has QCOR. Check out this weekly chart.
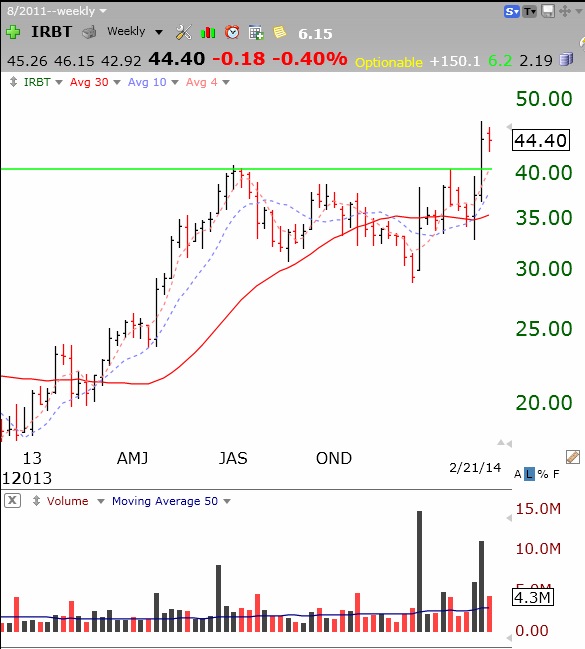
IRBT, a stock Judy has been talking about for a long time, also broke out last week. Check out this weekly chart. I like the large volume spikes.
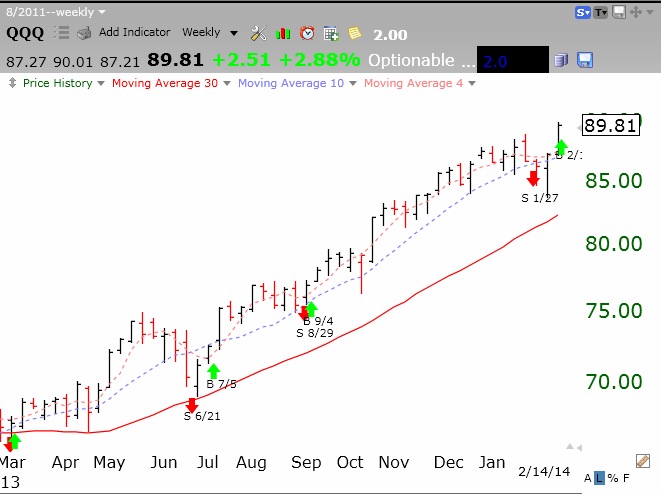
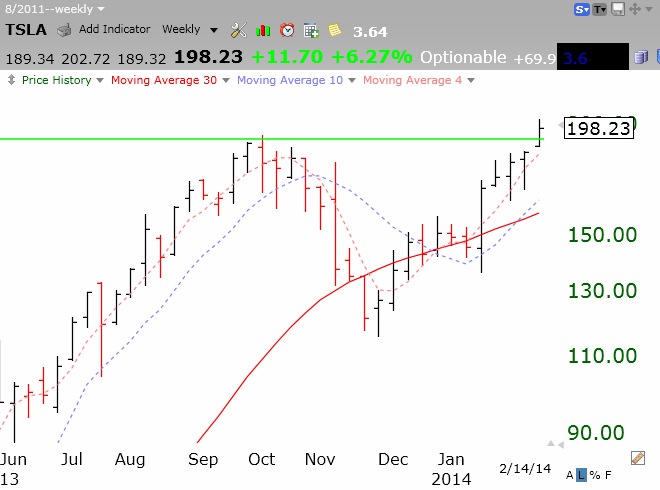
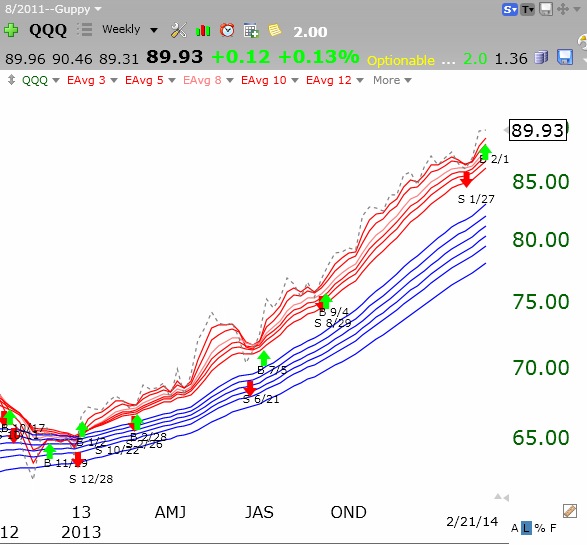
Meanwhile, QQQ remains in a beautiful RWB rocket pattern. Tech stocks rock!!!!!
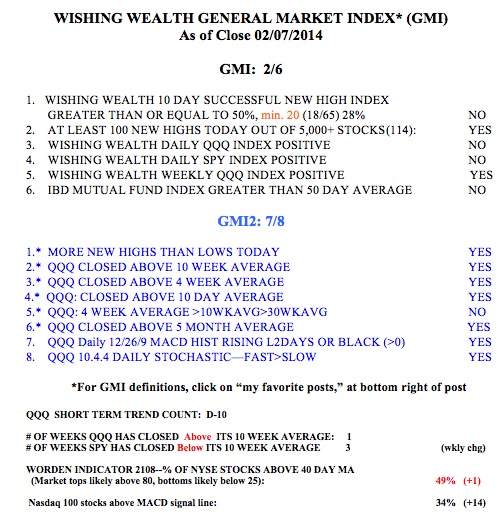
This up-trend is reflected in the GMI stats: