I thought you might like to know a way to buy a stock for little money down using deep in-the-money call options. I became aware of this option (pun intended!) by reading Lee Lowell’s wonderful book on ways to get rich from options. A call option provides someone the right (but not the obligation) to buy 100 shares of a stock at a particular price (strike price) for a period of time (until option expiration). Most people gamble with call options and try to buy a cheap call that is far out-of-the-money. For example, if one goes to yahoo finance and enters AAPL and then selects options, one can get a whole table of possible call and put options for AAPL.
Looking at this table of May options on Sunday evening, I see that I could buy an out-of-the-money call on AAPL with a strike price of $270 for about $2.47 per share or $247 total for 100 shares (excluding commissions). This call gives me the right to buy 100 shares of AAPL at $270 per share through May option expiration (3rd Friday of each month). Since AAPL stock is trading at $247.40, this option is far out-of-the-money. It would have no real value to anyone until AAPL is above $270 per share (strike price). The reason people are willing to buy the option for $2.47 per share is that they hope (and are betting) that AAPL will be above $270 by option expiration. The money they are paying for what is currently a worthless option is called time premium. In fact, this option buyer would have no profit at expiration unless the stock is selling at $270 + $2.47 (price paid for option) = $272.47 This is gambling. But remember, if AAPL closes at, say $280 per share by option expiration, the option that was bought for $2.47 per share would now be selling around $10 per share, a quadrupling of the initial investment! This is because one could execute the option and buy the 100 shares at $270 per share and then turn around and sell them immediately in the market for $280 per share. One does not need to buy the shares, however, to reap the profit. Before the option expires, one could just sell the option in the option market for around $10 per share ($1,000 total) in this example.
But an unusual characteristic of options is that as the option is deeper in-the-money, the time premium becomes very small and a small rise in the stock can make the option profitable to a buyer. For example, the May call option with a strike price of $220 is offered at $29.40 per share, or $2940 for 100 shares. This means that I could pay $2940 to control $24,700 worth of AAPL through May expiration. Since AAPL is trading at $247.40, the May $220 call already has real (intrinsic value) value of $27.40 per share ($247.40-220.00). Since the option would cost me $29.40 per share, the stock only needs to rise $2.00 to $249.40 before I begin to make money as AAPL rises. Thus, for an investment of $2940 I get to reap the benefit of the gains in a $24,700 stock. This equals about a 12% down payment, without the need to go on margin and pay interest!
What is the down-side? Since I pay $2940 for the option, if AAPL closes below the strike price of $220, the option would expire worthless (why would someone buy the right to buy a stock at $220 if at expiration the stock is trading below $220?) So, one can lose the entire investment if the stock falls a lot. But this strategy loses less money than if one had paid full price for 100 shares and then seen it fall far below $220! The most one can lose is what they paid for the option. The big temptation to be avoided here is using the leverage to buy options on more shares than one could have bought outright. That is the way to make a huge bet and lose a lot of money. I use this option strategy to buy the right to purchase about the same number of shares I would have been able to purchase.
If you like this strategy, I suggest you read Lowell’s chapter on this topic. Also, read up on how to open an options account and trade options. By the way, I would not even consider buying AAPL call options until after the earnings come out this week. Look what happened to other high fliers last week, after they reported great earnings.
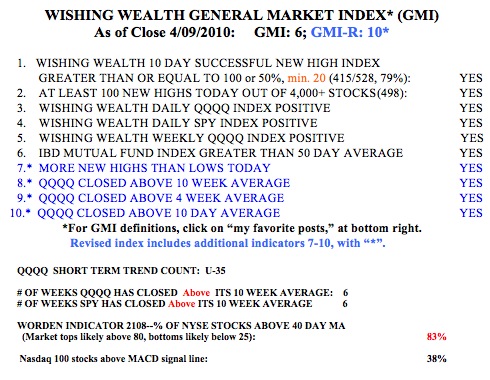
Now, the GMI and GMI-R are still at their maximum values. However, the action in ISRG and GOOG led me to sell out some positions on Friday.  I think it is a warning sign when the leaders crack like that. Remember, as trend followers, we only tend to exit the market after the trend has changed. Thus far, the markets remain in an up-trend. However, I am moving my stops up and am ready to get defensive. Friday was the 4oth day of the current QQQQ short term up-trend. The last time the QQQQ closed below its 10 day average was February 23rd! That moving average is now at 49.17, only .36 below the current value of QQQQ. It would not take much of a decline in QQQQ to break below this important moving average. Note that the Worden T2108 Indicator is now below 80% and may be getting ready to decline. Be careful out there. Things probably can’t get much better.