I had the opportunity the past few weeks to listen to CNBC and other financial reporters more than usual. I am tired of listening to them pontificate about how long the decline will last and whether gold can climb higher. No one knows the answers to such questions. The market is a collection of people and machines voting with their money millions of time each day. Trying to predict their actions is a foolish endeavor.
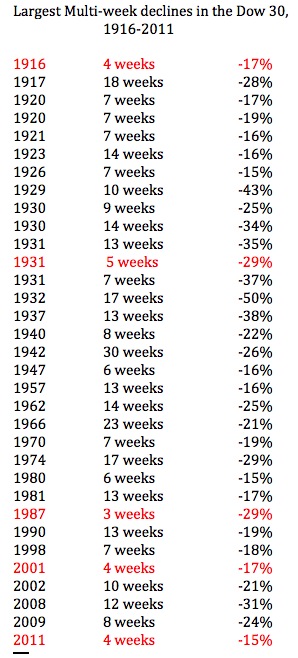
One of the most stupid ideas I have heard is to suggest that the current market decline is unique and caused by high frequency traders or program traders. Human psychology has not changed and market behaviors continually repeat themselves.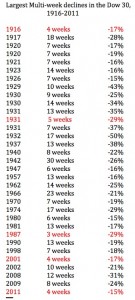 I decided to look at the long multi-week declines of the Dow 30 Index since 1916. I computed the duration and depth of every multi-week decline that has occurred. I defined a multi-week decline as one when the Dow declined at least 15% in a few weeks without a consolidation along the way, in other words, a steep, unceasing decline. My calculations were quick and dirty so do not hold me to them exactly. They still paint a valid picture. I found that the current decline is not unusual. The Dow has now declined about 15% in 4 weeks. Since 1916, there were 4 other declines (in red) that lasted just 4 weeks and lost at least 15%. They occurred in 1916, 1931, 1987, 2001. This does not include the other declines in this table that lasted longer than 4 weeks and probably fell as much in the first 4 weeks of decline. My point is that the current decline is nothing new. How many of these declines that occurred before the PC can we blame on program trading or high frequency trading! Note that 30 of these 33 declines were greater than the current 15%. So this decline may have a lot further to go…….
With bullish sentiment about twice bearish sentiment, I think this decline may have a lot further to go. But, as I said before, nobody knows. So the best strategy for me is to remain out of the market until the new bottom is in. I could go short by buying puts or inverse ETF’s. But sometimes it is just relaxing to be away from the market. In declines I continue to monitor the new high list for potential leaders in the next up-trend.
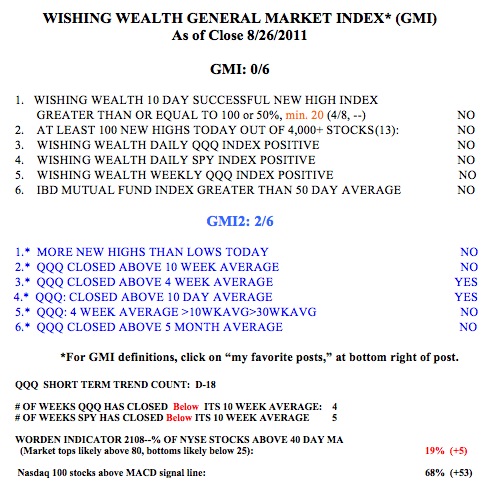
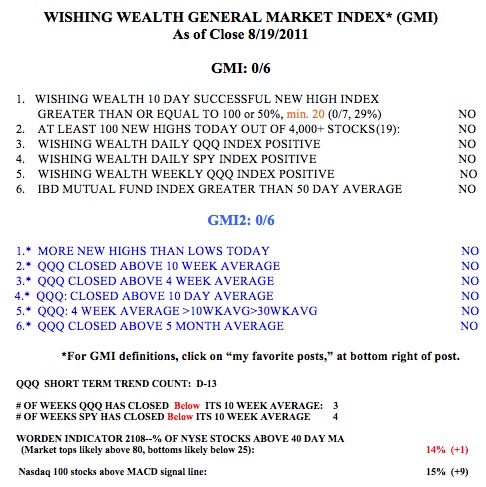
The GMI and GMI-2 remain at zero.