China in Free-fall, buying FXP; QQQQ completes 8th day of short term down-trend

GMI1/6
GMI-R1/10
T210828%

Every once in a while the charts become so bad that they scare me.   I check a number of market indicators every night and was concerned by the current steep decline in the Shanghai Composite Index.   The weekly   chart (and monthly chart, not shown) are very ominous.   
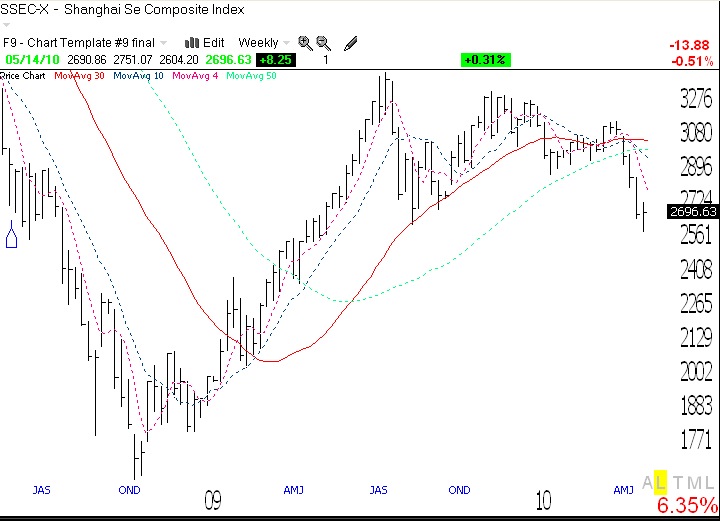
After a major decline (almost 70%) from 2007 to 2008, this index began a rebound in which it almost doubled from the bottom, until August of 2009. Since its August top, the Index declined and made another failed attempt to rise, topping out in November, 2009.   It then declined again and made one last feeble attempt to rise, topping out in April 2010.   When that rally failed, the Index broke down below prior support and now appears to be in a free-fall.   Where it will stop is any person’s guess, but we do know that China’s government is trying to cool the economy.   In the U.S., when the Fed tries to cool the economy from a boom, it usually ends with disastrous consequences for the market.   While I think a crashing China would have disastrous consequences for the rest of the world that has been banking (pun intended) on China to help the world recover from its recession, I can still look for a way to profit from   the decline in this Index, if it continues.   I have therefore purchased a little of FXP, the Ultra Short ETF that tracks the daily performance of the FTSE/Xinhua China 25 Index. FXP is designed to rise twice as much as this Index falls. I know these ultra ETF’s can be very volatile and I therefore bought a few shares with the idea of adding to my position if the decline continues.   What caught my attention was the largest weekly volume of trading in FXP the last few weeks as it started to rise. 
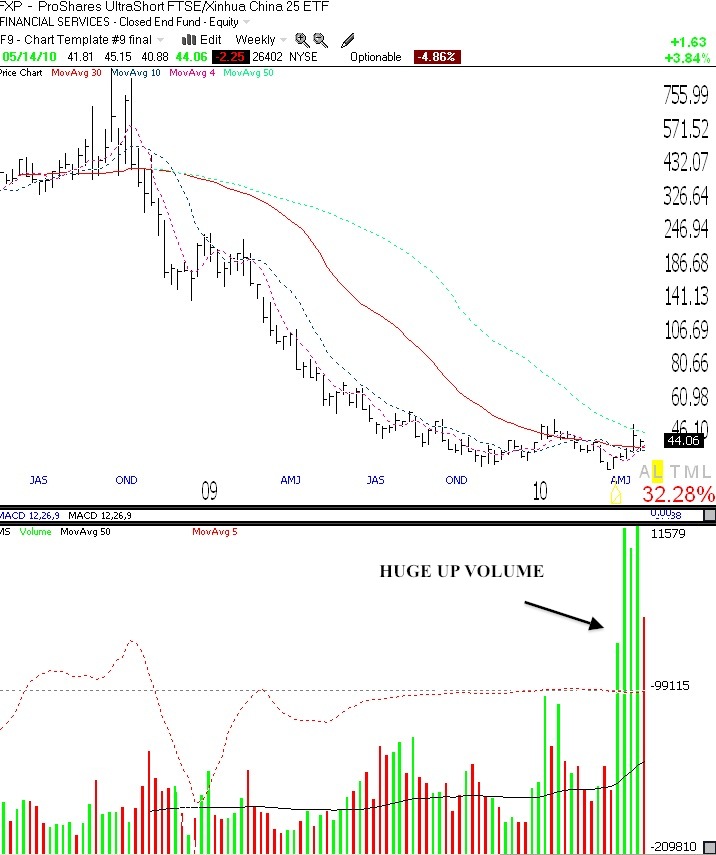
So, the big boys are apparently buying FXP.   The volume of shares traded in FXP the past 5 weeks is the highest that it has ever been since this ETF started trading in 2008.   My students should see immediately from this weekly chart that this ETF may be completing a Stage 1 base and beginning a new Stage 2 up-trend.   It is still too early to know if this is happening, but I thought it was worth taking a small position in FXP, given the recent up volume (green bars). The other ominous situation I am tracking is the relationship between the China and the U.S. markets.   Both the China and U.S. markets declined steeply in 2008 and rebounded, but China’s market bottomed 5 months before the U.S. market. Now that China’s rebound appears to be over, could the U.S. market’s rebound also end   soon?

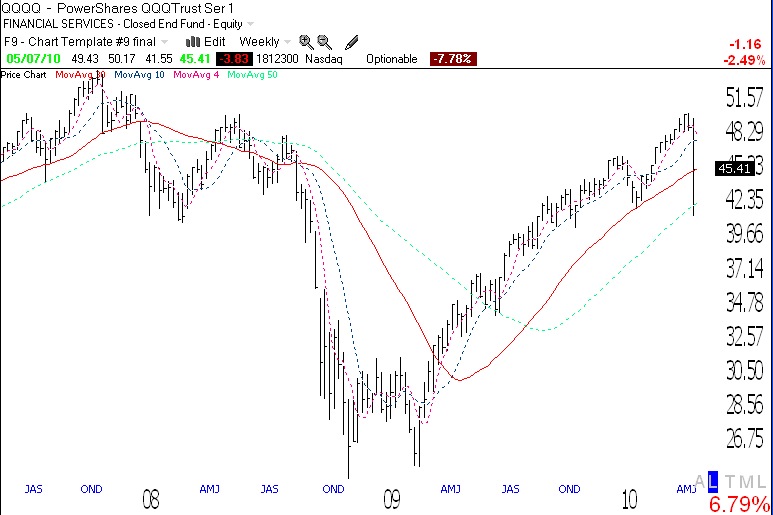
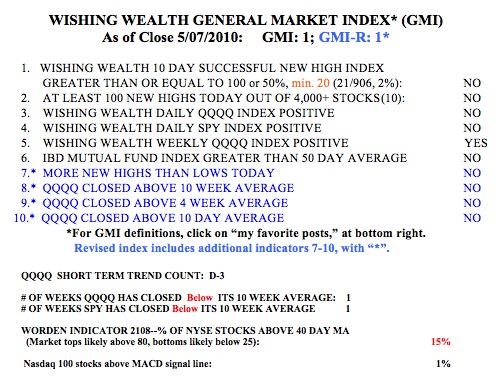
To answer that question, I rely on my GMI and GMI-R, which are both registering one point. We are in the middle of a short term down-trend in the QQQQ and I am in cash, fully hedged, or short in my trading IRA.   The one remaining positive indicator is my longer term, Weekly QQQQ Index.   If that should turn negative, making the GMI and GMI-R register zero, I will consider moving my university pension funds from mutual funds to money market funds. I typically, however, like to see a Stage 4 down-trend begin before I do that. 
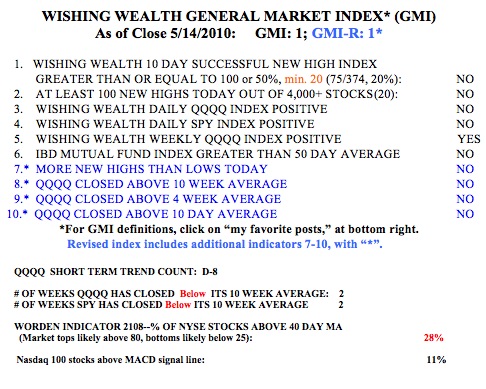
Meanwhile, we are in the 8th day of the current short term QQQQ decline (D-8).   Since the inception of this decline (D-1), the QQQQ has fallen -2.6%, and 90% of the Nasdaq100 component stocks and 81% of the S&P500 stocks have declined.   So much for trying to find the few winners to go long with.   My students know that to have an edge in trading one must trade with the market’s trend, not against it. The Worden T2108 Indicator is now at 28%, out of oversold territory, having rebounded from 15% last Friday.   With options expiring this Friday, things could get very volatile.   I am content to be mainly on the sidelines with a bias towards the short side…….

Great Washington Worden Seminar; Market in short term down-trend; Mainly in cash

GMI1/6
GMI-R1/10
T210815%

On Saturday,   I had the opportunity to present for 2.5 hours at the Worden software work-shop.   I showed the audience how I use TC2007 to manage my trading. It was gratifying to see the warm reception I received from a   local, primarily older adult group.   I just finished two courses at the university and have been accustomed to lecturing to college students.   It was a new experience for me to present to a class of people who were their parents’ ages.   A big surprise was that my star student from three years ago surprised me by attending the work shop and told me that when he graduates in a few weeks, he will move to California to open up his own mutual fund.   The year after he completed my course, he made a lot of money buying put options (betting on a decline)   on USO during its dramatic decline in 2008, from over $100 to around $22. So the afternoon presentation was an exciting time and most of the 120 attendees said they would take my course on the market if it were ever offered more widely………

The market action last week spooked a lot of people.   My account actually rose on bizarre Thursday, with my position in TYP. This is now a good time for me to be in cash on the sideline.   The GMI and GMI-R are both back to one.   The only indicator that is still positive is my weekly indicator of the QQQQ.   The QQQQ remains in a Stage 2 up-trend (see weekly chart of QQQQ), as defined by Stan Weinstein (see his book to right).   So, in my trading account I am short and mainly in cash.   In my university pension I remain fully invested in mutual funds.   I only transfer my pension funds to cash when the weekly trend enters a Stage 4.   By that time, the 30 week average will have curved down.   I have successfully avoided past major down-trends by getting out at the beginning of a Stage 4. Note that the QQQQ closed right on the 30 week average (red). As long as the 30 week average continues to rise, I will ride this up-trend in my pension account.

In spite of the short term down-trend in the QQQQ, I do not   think this is the time for me to begin to short stocks in my trading account.   This is because the Worden T2108 indicator, at 15%,   is already in an area where prior bottoms have occurred.   If this indicator, which declined from 64% last Friday, should hit single digits this week, I would be looking for a bottom.   I might even buy some QLD (ultra long QQQQ ETF), if that occurs. Every time I have said this, I get scared when the T2108 hits such a depressed level.   This time I will try to take advantage of a further drop into such an extreme level.   The T2108 touched 6% at the re-test of the bottom in   March, 2009, and 1% at the panic bottom in October, 2008.   These were extreme readings, however, not seen any other time in the past decade.   Friday was the third day of the new QQQQ short term down-trend.   I will be more certain of this new down-trend if it lasts for 5 days.   Once we pass that point, trends tend to last for a while.   Note that only 1% (1) of the Nasdaq 100 stocks closed with its MACD above its signal line, another sign of short term weakness. For the first time since February 4th, there were more new 52 week lows than highs (46 vs. 10) in my universe of 4,000 stocks.   This is not the time for me to be buying stocks at new highs.

I looked at the performance of the IBD 100 list published on Monday, 4/12/2010. Since these stocks closed on 4/9, only 17% have advanced through last Friday.   Put another way, during this period the QQQQ has declined 7.4%, while more than half of the IBD100 stocks declined 9.5% or more.   Growth stocks tend to go up more in up-trends and decline more in down-trends, as traders take profits. For example, since 4/9 to 4/26 when the QQQQ topped, 50% of this IBD100 list advanced 4.9% or more, while the QQQQ increased only 2.8%.   So I continue to concentrate my buying in IBD100 stocks, but only in QQQQ short term up-trends (within a longer term up-trend).

By the way, remember I ran my submarine scan on 4/29?   Well, since then, all nine of the stocks that came up have declined, as did all of the Nasdaq 100 stocks.   Three of the nine (33%), however,   are down 17% or more, during a time when the QQQQ declined by 9.6%, but only 5% of the Nasdaq 100 stocks declined 17% or more. So,at least that time, the submarine scan did select stocks with a greater likelihood of sinking more during this period.

Remember, one must trade with the trend in order to maximize the chances of success. Right now, the short term trend is down, and I will not go long.   (The longer term trend is still up (Stage 2), so I will keep my pension invested in mutual funds and continue to dollar coast average in with new contributions, until it looks like Stage 2 is over.)   I trade like a chicken, run from a down-trend, and conserve my capital to trade only when the odds are in my favor.

Market Showing Serious Signs of Weakness; Surprising TC2007 Submarine Scan Results

GMI5/6
GMI-R7/10
T210864%

I have noticed that during market up-trends, stocks tend to rise in anticipation of the release of good earnings.   Once the results come out and after the immediate reaction, many stocks tend to regroup and often decline, until they begin to rise as the next quarter’s earnings season approaches.   We are now in the period when many stocks have reported and we may be in the refractory period when stocks consolidate or decline.   Regardless of the true story underlying recent market action, it is clear to me that my indicators are weakening and that the coming week could cause a serious deterioration in the GMI and GMI-R.   If a short term down-trend begins, we never know how long it will last.   We have to wait for definitive signs of a new up-trend.

So, here are the facts as I see them now.   First, many of the stocks that led this advance are breaking down or failed to hold new highs reached recently (GOOG, ISRG, GMCR,to name a few I have traded). Even AAPL, the leader of the tech sector, could not hold new high ground last week.   (AAPL remains in an up-trend.)   Then, the Worden T2108 Indicator began to break down, now at 64%, and is in a down-trend.   This pendulum of the market is an excellent indicator of market extremes.   Having held around 80% since early March, it finally has begun to decline.   Many market declines bottom out when T2108 is around 20%. (T2108 measures the percentage of NYSE stocks that closed above their average price over the past 40 days. If a stock is trading below its average price over the past 40 days, one might think of it as a sign of weakness.) I also monitor the percentage of Nasdaq 100 stocks whose daily MACD (12/26/9) is above its signal line.   That percentage is now at 24%, lowest since last February and is another sign of short term weakness. The GMI is at 5 and the GMI-R is at 7.   (The QQQQ short term up-trend completed its 50th day on Friday.)   A further market decline next week could reduce these values quickly, but I try not to jump the gun.

I told you that to hedge my long positions I had purchased call options on gold (GLD) and on the 3X   Tech Stock Short ETF (TYP) that rises as tech stocks fall.   Both of these positions advanced last week, minimizing declines I had in a few remaining long positions.

As long as the general market indexes remain in up-trends (and this could change next week), I do not like to short stocks.   But I wanted to alert you to a scan I ran using TC2007 to find “submarines,” stocks that appear to be entering a major down-trend, according to certain technical patterns I watch.   Because I look for fallen leaders to short, this scan was limited to stocks in my TC2007 watchlist that contains present/past IBD100 or New America stocks, published by IBD.   Note that stocks typically begin declines before the fundamental reasons become public.   Therefore, when I short, I rely solely on the technical patterns.   I was so surprised to see some of the stocks that came up in this scan that I thought I would post the list.   If I   owned any of these stocks (which I would not, because they are below critical levels I follow), I would move my sell stops up, hedge them with puts, or sell them outright.   I do not buy “bargains” that have declined far from their tops. This is not a recommendation, just intended to teach you how technical analysis can be used to reduce risk.

Here is the list of 13 stocks: MSTR, SWN,CVLT,GILD,ATHN,PWRD,NTES,GS,ABVT,SYKE,GOOG,SQM,MCFE. Some of these stocks had terrible days last week but did show up in my scans before those days.   To my surprise, GS and GOOG are on the list.   I was especially interested in the fact that two stocks in the same industry showed up with ominous similar chart patters, PWRD and NTES.   This “naked” weekly chart of PWRD,without prices, shows more clearly the pattern of key weekly moving averages.  (NA represents about when the stock was written up in IBD’s New America column.)   When the shorter averages (4 dotted, 10 blue) are below the longer term average (30 red) which itself is beginning to curve down, it suggests to me that the prior up-trend is over and a new down-trend is likely. The end of the up-trend should be evident to even eyes unaccustomed to technical analysis. When shorting, I like it if multiple stocks in the same industry are failing, indicating a potential sector-wide decline.   (Both NTES and PWRD are Chinese online gaming stocks.) Over 2 years ago, I wrote about an impending meltdown in the banking sector when I saw how many financial stocks were giving me similar sell signals.   With regards to this list of   stocks, maybe I am wrong this time….