There are a number of stocks that came up in my “Darvas Scan” that are trading near five year highs and have good technicals and fundamentals. These stocks include: NEU, PCLN, AMZN, NFLX, EGO, LZ, CML, ABV, CBD, WCRX, EW, WES, CPLA. Some of these stocks may turn out to be rockets if the market up-trend continues. Meanwhile, the GMI
General Market Index (GMI) table
Market up-trend back on track after bouncing off of Bollinger band; Gold shines, STEC falters.
Well, the indexes again bounced off of their lower Bollinger bands and the market’s short term up-trend resumed. Note the 5th bounce that I just added in red to the chart I posted on 10/19 after four bounces. 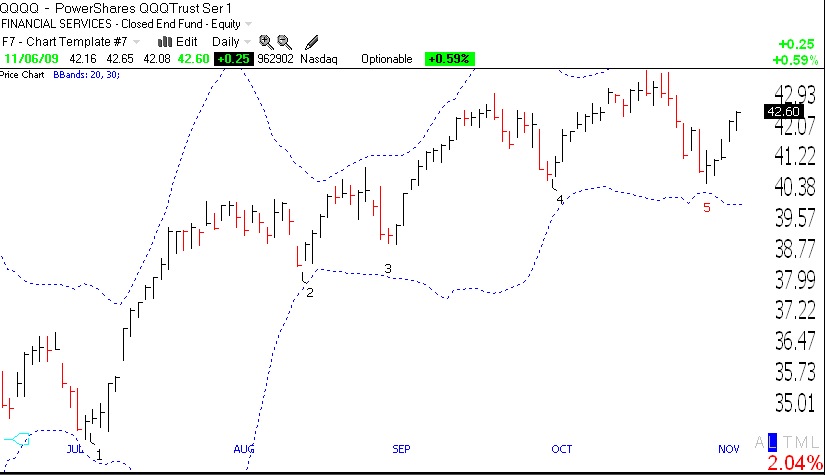 Review that post if you want to understand the logic of Bollinger bands. If only I had the patience to wait for the bounce to enter my long positions! Maybe next time. The QQQQ is even back above its 10 week average! So, as much as I hate being whipsawed by the recent decline, if I flew solely by instrument, I would have to be long again. But watch out for a possible right shoulder forming in a head and shoulder pattern. If the QQQQ falters before it surpasses the peak reached on 10/21, we could see a large drop, especially if QQQQ closes below the neckline, around 40.6 . So, if I go long, I will place some close sell stops and monitor QQQQ’s progress very carefully. Meanwhile, the GMI is
Exciting New Worden stock tool–volume buzz at FreeStockCharts.com
I recently attended a Worden seminar about their new software, StockFinder.com, which will eventually probably replace TC2007, my favorite analytic program. While there, they talked about the free software that they make available to everyone, Freestockcharts.com. Freestockcharts.com is a platform that is very similar to their new StockFinder software, but it is free and provides real time charts and statistics. While many sites provide intraday prices, I learned at the seminar that Freestockcharts.com has an indicator called “volume buzz.” Volume buzz compares each stock’s volume to its average volume at a specific time during the trading day. (I do not know over how many time periods the average is computed.) So, for example, at 10:05 AM I can rank my watchlist by how each stock’s current volume at 10:05 AM compares with its average volume at 10:05 AM.
I can therefore see anytime during the day whether a stock is trading an unusually high or low number of shares. 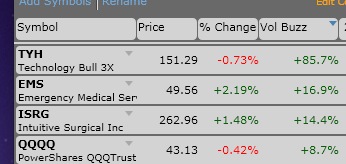 Volume buzz therefore enables someone to spot unusual volume in their specific watchlist anytime during the trading day. One just edits the watchlist column to include volume buzz. The picture to the right, taken after Friday’s close, shows that the volume for TYH on Friday was 85.7% above its average total trading volume by the end of the day. Of course, if I had taken a screen shot during the day, the volume buzz statistic would have been computed based on the exact time during the trading day when I would have taken the screen shot. Pretty neat!
Freestockcharts.com also enables me to set alerts for each stock, that can be emailed to me immediately when a stock trades in a specific way. (A larger number of alerts and stock scans require a paid for premium service.) Check it out. Meanwhile, the GMI is at 5 and the GMI-R is at 9. The indexes are still near the top of their Bollinger bands and it may not be a great time to start taking on new longs.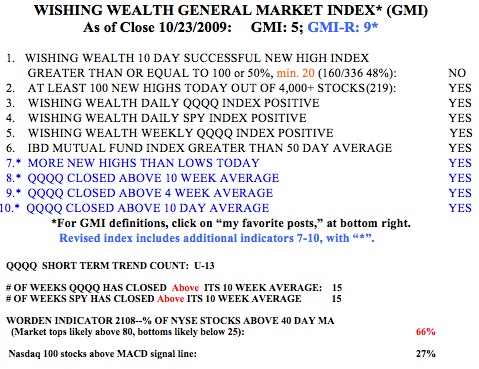 But as long as the longer term trends are up, chances are that the daily advance will resume suddenly. When stocks surge on good earnings, like AAPL, AMZN and NFLX did last week, we know that we are in a strong up-trend where funds and traders are buying strength. The QQQQ and SPY index ETF’s have closed above their critical 10 week averages for 15 straight weeks. It is unfortunate that so many people have missed this rise. One needs to follow the trend and not try to second guess it. As long as the trend is up, I can go long and manage risk by placing sell stops beneath key support levels.