I have been writing for some time about the fact that the current QQQ short term up-trend, was approaching the longest duration of any short term up-trend since 2006. Since 2006, there have been 52 short term up-trends in the QQQ. This table shows the length of the ten longest. 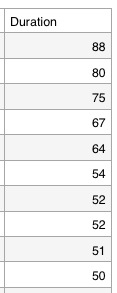 The current up-trend is now in its 72nd day and is the fourth longest up-trend since 2006, the way I define them. Another down or flat day in the QQQ will begin a new short term down-trend. If that happens, the GMI might also approach a Sell signal. (IBD now sees the “Uptrend under pressure.”) I also wrote last week, however, that the end of a short term up-trend has not necessarily implied the beginning of an extended short term down-trend. The new down-trend could become only a short pause in this long term up-trend. The fact that the Worden T2108 indicator , the put/call ratio and my other favorite technical indicators are not at extremely oversold levels leads me to conclude that we have more of a decline to come. But no one, including me, knows for sure what will happen. I am therefore 90%+ in cash in my margin and trading accounts. I remain fully invested in mutual funds in my university pension accounts, which limit my ability to go in and out. As long as the market remains in a Weinstein Stage 2 up-trend, I will stay invested there.
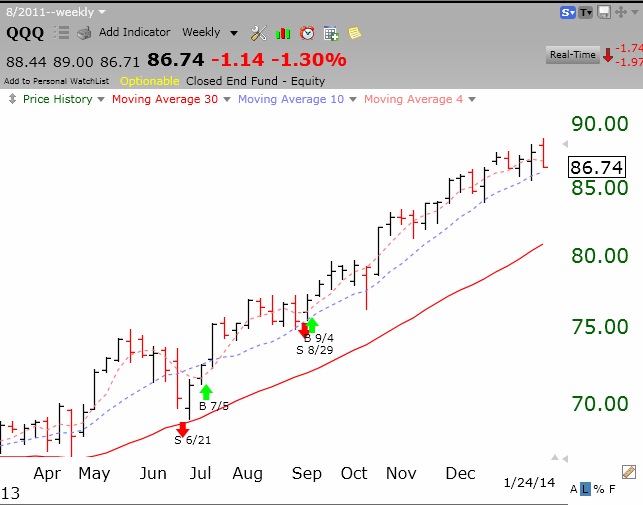
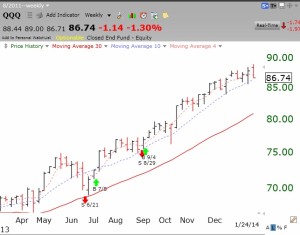
The weekly chart below shows the QQQ to be in a firm Stage 2 up-trend, well above its rising 30 week average (red line). It is also resting on its 10 week average (blue dotted lone) and I have found in the past that I could not make money trading growth stocks when the QQQ is below this important moving average. Also note that the QQQ could fall quite a distance to its red line support without breaking the longer term up-trend, as it did in June, 2013. Everyone must determine his/her own tolerance for risk.
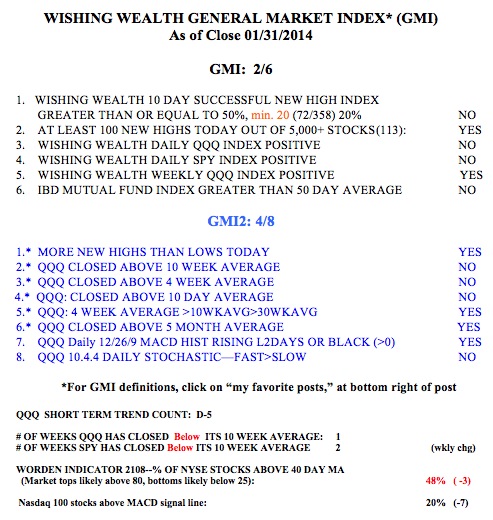
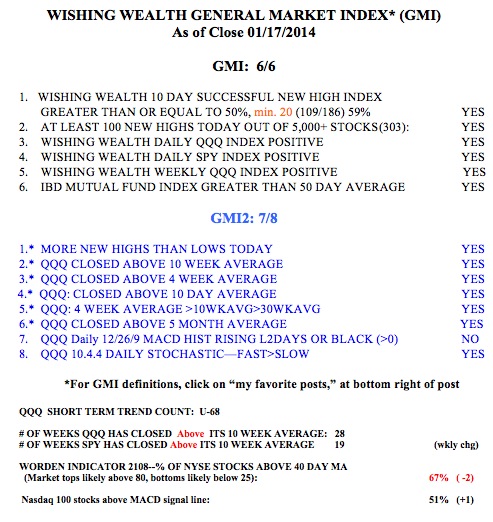
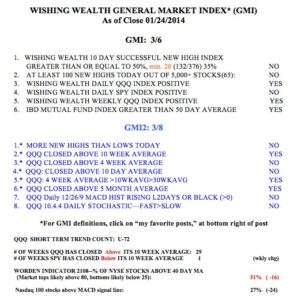
The GMI has now fallen to 3. If it remains below 3 for two days it would flash a Sell signal.
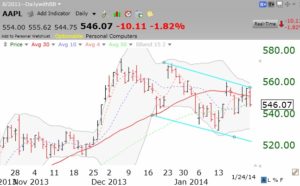
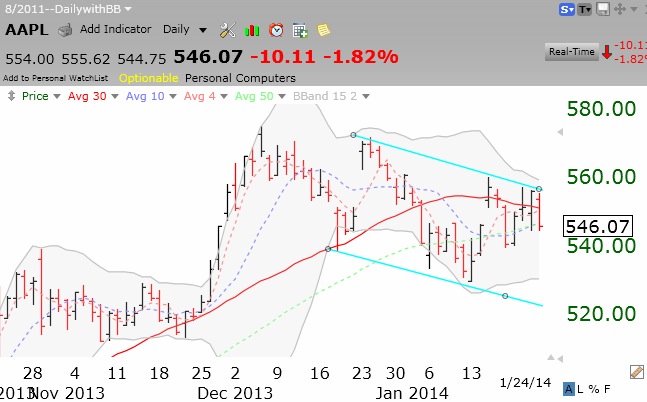
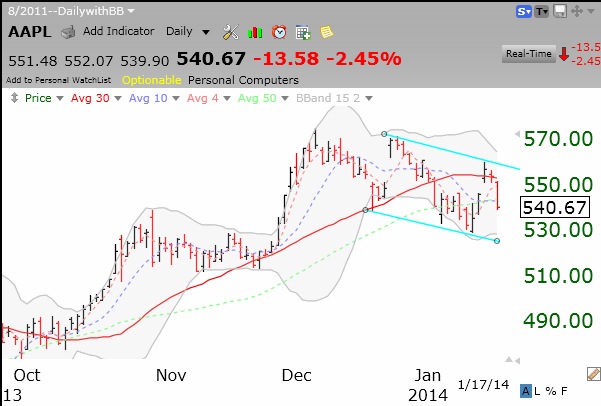
AAPL reports earnings after the close on Monday. This daily chart shows AAPL to be in a declining price channel. It will be interesting to see if an earnings surprise can enable the stock to break out of this formation. We will know Monday night after the close when we will see extended hours trading in AAPL.